
1. INTRODUCTION
Protein hydrolysate is a product of digestion containing high-quality amino acids. It is used as nutraceuticals or functional food [1]. Furthermore, it is known that hydrolyzed protein products have higher biological activity and functional qualities than non-hydrolyzed [2]. This bioactivity is influenced by the content of peptides, which have a specific amino acid structure and sequence [3].
Canary (Canarium indicum L.) is an Indonesian indigenous plant that grows primarily in the country’s Eastern region, specifically in Northern Maluku [4]. The deffated Canarium is a by-product of Canary oil extraction (Nangai oil), conducted using mechanical pressure. The protein content of the sample is increased by the defatted procedure [5]. Defatted walnuts are still limited to animal feed [6]. Therefore, C. indicum L. defatted is used as a functional food supplement or an active cosmetic component containing antioxidative peptide with additional procedures, including hydrolysis.
The protein hydrolysate production was optimized with an antioxidant activity using three different enzymes, namely, papain, flavourzyme, and pepsin. The specificity of the enzyme to the substrate results in several advantages in the production of protein hydrolysates with proteases, which were conducted in mild settings to avoid side reactions. Furthermore, the hydrolysate produced does not reduce the nutritional value of the protein [7]. Several factors can affect the yield and quality of the protein hydrolysate, including the properties of the substrate, the nature of the enzyme, and the process conditions (temperature, pH, hydrolysis time, and addition of water) [2]. The aim is to determine which method produces the protein hydrolysate with the highest antioxidant activity, measured by a low IC50 value, and also analyze the factors that influence the production of antioxidative protein hydrolysates.
2. MATERIALS AND METHODS
2.1. Materials
Canary (C. indicum) plant samples were collected from Makian Island, North Maluku, Indonesia. Papain (Merck), Flavourzyme (Merck), Pepsin (Merck), Sodium dodecyl sulfate (Merck), CuSO4.5H2O, Bovine Serum Albumin (Sigma-Aldrich), Ninhydrin (Merck), L-Leucine (Sigma-Aldrich), 2,2-diphenyl-1-picrylhydrazy (Himedia), and Ascorbic acid (Merck) were used in the analyses.
2.2. Sample Preparation
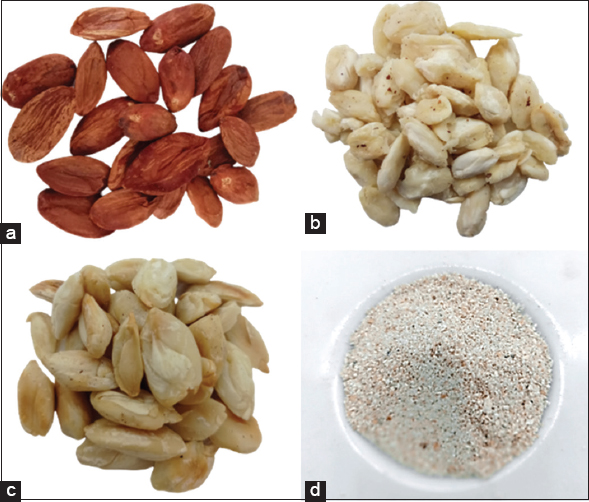
The Canary seeds (Nut in Testa) were roasted at 60°C for 60 min. After which, the testa was peeled to obtain the canary kernels/nuts. The kernel was pressed at a pressure of 100 kN/m2 for 5 min, later increasing to 250 kN/m2, resulting in a defatted canary seed/kernel. The defatted canary seed was grounded into powdery form and sieved to achieve a uniform particle size.
2.3. Extraction of Canary Seed Protein
200 g of defatted canary seed flour was extracted with 1000 mL of 0.15 M Phosphate Buffer pH = 7 or 0.15 M HCl Buffer pH = 2. Furthermore, the extraction was performed in a blender for 2 min. The extract was filtered using a filter cloth and refrigerated for at most 12 h before being used as material to produce Canarium protein hydrolysate.
2.4. Production of Canary Seed Protein Hydrolysate
Proteases including papain, flavourzyme, and pepsin were used to hydrolyze canary seed protein. The response surface methodology with a Box–Behnken design optimized the protein hydrolysate production. In which, 17 trials were conducted randomly involving several factors, such as hydrolysis time (hours), enzyme/substrate concentration ([E/S]) (%), and temperature (°C) [Table 1]. The optimization was performed using the trial version of Design-Expert software (Stat-Ease Inc., Minneapolis, USA). To produce protein hydrolysate, the pH of papain and flavourzyme was adjusted to 7, while pepsin was used at a pH of 2.0. This experiment’s factors and levels were based on a literature research of protein hydrolysate and preliminary experimental data.
Table 1: Experimental design for the production of protein hydrolysates using various enzymes.
| Papain | Flavourzyme | Pepsin | |||||||||
|---|---|---|---|---|---|---|---|---|---|---|---|
| Code | Time (h) | [E/S] (b/v) (%) | Temperature (°C) | Code | Time (h) | [E/S] (b/v) (%) | Temperature (°C) | Code | Time (h) | [E/S] (b/v) (%) | Temperature (°C) |
| A1 | 3 | 1 | 55 | B1 | 1 | 0.55 | 50 | C1 | 3 | 0.1 | 37 |
| A2 | 3 | 0.1 | 55 | B2 | 3 | 0.1 | 50 | C2 | 5 | 0.55 | 37 |
| A3 | 5 | 0.55 | 55 | B3 | 5 | 0.55 | 50 | C3 | 3 | 1 | 37 |
| A4 | 1 | 0.55 | 55 | B4 | 3 | 1 | 50 | C4 | 1 | 0.55 | 37 |
| A5 | 3 | 0.55 | 60 | B5 | 3 | 0.55 | 55 | C5 | 3 | 0.55 | 39.5 |
| A6 | 5 | 0.1 | 60 | B6 | 3 | 0.55 | 55 | C6 | 5 | 0.1 | 39.5 |
| A7 | 3 | 0.55 | 60 | B7 | 5 | 0.1 | 55 | C7 | 3 | 0.55 | 39.5 |
| A8 | 3 | 0.55 | 60 | B8 | 3 | 0.55 | 55 | C8 | 3 | 0.55 | 39.5 |
| A9 | 1 | 0.1 | 60 | B9 | 3 | 0.55 | 55 | C9 | 1 | 1 | 39.5 |
| A10 | 5 | 1 | 60 | B10 | 1 | 0.1 | 55 | C10 | 1 | 0.1 | 39.5 |
| A11 | 3 | 0.55 | 60 | B11 | 1 | 1 | 55 | C11 | 3 | 0.55 | 39.5 |
| A12 | 1 | 1 | 60 | B12 | 5 | 1 | 55 | C12 | 3 | 0.55 | 39.5 |
| A13 | 3 | 0.55 | 60 | B13 | 3 | 0.55 | 55 | C13 | 5 | 1 | 39.5 |
| A14 | 3 | 0.1 | 65 | B14 | 3 | 1 | 60 | C14 | 3 | 0.1 | 42 |
| A15 | 3 | 1 | 65 | B15 | 1 | 0.55 | 60 | C15 | 3 | 1 | 42 |
| A16 | 1 | 0.55 | 65 | B16 | 5 | 0.55 | 60 | C16 | 1 | 0.55 | 42 |
| A17 | 5 | 0.55 | 65 | B17 | 3 | 0.1 | 60 | C17 | 5 | 0.55 | 42 |
2.5. Proximate Analysis
The Association of Official Analytical Chemist [8] method was used to conduct proximate analysis of Canary kernel, as well as roasted and defatted Canary kernel.
2.6. Lowry Protein Assay
The protein content of the sample was determined using Lowry’s method in accordance with [9-11]. First, a stock solution of Reagent A was prepared using 2% Na2CO3, 0.4% NaOH, 0.16% sodium potassium tartrate, and 1% SDS, while the stock solution of Reagent B was produced using 4% CuSO4.5H2O. There were combined in a ratio of 100:1 (Reagent A: Reagent B, yielding Reagent C or alkaline copper reagent). Afterward, 1 mL of the sample (containing 50–250 μg of protein) was added to 3 mL of Reagent C and incubated for 60 min at room temperature. Then, 0.3 mL of 50% Folin–Ciocalteu solution was added, and the mixture was set for an additional 45 min. Finally, an absorbance reading at λ = 737 nm (maximum wavelength) was recorded.
2.7. Degree of Hydrolysis (DH)
The evaluation of the DH was modified from Moore and Stein, Pearce et al., and Zhang et al. [12-14] based on ninhydrin methods (1). Solution A preparation involved 80 mg of SnCl2 dissolved in 50 mL of Citrate buffer (0.2 M; pH=5.0) and purified using N2 gas (2). Solution B preparation involved 0.5 g of Ninhydrin dissolved in 10 mL of DMSO (3). Quenched Buffer preparation contains 12% (w/v) PEG 6000 and 25mM EDTA (4). Preparation of Ninhydrin Reagent involved the combination of solution A and B in a volume ratio of 1:1 (5). The preparation of a Standard Solution of L-Leucine includes dissolving 25 mg L-Leucine in 25 mL of phosphate buffer (0.2 M; pH = 8) at a concentration of 1 mg/mL (stock solution). Then, a series of concentrations of 0.500, 0.100, 0.075, 0.050, 0.025, and 0.01 mg/mL were prepared from the stock solution (6). Reaction: 50 μL of sample/standard solution (L-Leucine) and 50 μL of Quenched Buffer were added to the microtube, followed by 500 μL of ninhydrin reagent. The reaction was performed in a water bath at 80°C for 10 min (ensure the microtube cover is tightly closed). After the microtube reached room temperature, 1000 μL of distilled water was added and vortexed. Finally, the spectrophotometer UV-Visible measured the absorption at a maximum wavelength of 570 nm. The DH was calculated using the following equation.
 |
Where DH denotes the degree of hydrolysis, Lt denotes the amount of α-amino in a sample after hydrolysis under specified conditions, L0 denotes the amount of α-amino in non-hydrolyzed samples, and Lmax = the maximum amount of α-amino in the sample after 24 h of hydrolysis with 6 M HCl at 100°C.
2.8. Antioxidant Activity
Antioxidant tests were conducted using the 2,2-diphenyl-1-picrylhydrazyl (DPPH) free radical scavenging method, as described in Zhang et al., He et al., Yarnpakdee et al., and Erdo?an et al. [15-18]. In the dark vial, 1 mL of the sample/standard solution (Ascorbic acid) was combined with 1 mL of 0.1 mM DPPH. The mixture was incubated for 30 min at room temperature. The absorbance value was determined at a maximum wavelength of 515 nm. Next, a standard curve was constructed using ascorbic acid at concentrations ranging from 1 to 20 ppm. Finally, the following equation was used to calculate the percentage of inhibition.
 |
Where Acontrol = control absorbance (DPPH solution+methanol), Asample = sample absorbance. The IC50 value for each sample was determined using the regression equation between the sample concentration (x-axis) and the %inhibition (y-axis) obtained from the calibration curve.
2.9. Sodium Dodecyl Sulfate-polyacrylamide Gel Electrophoresis (SDS-PAGE)
The protein sample’s molecular weight profile was determined using a slightly modified method [19,20]. Furthermore, electrophoresis was performed using 12% and 4% of polyacrylamide separating gel and stacking gel, respectively. A sample of 25 μL containing 40 μg of protein was mixed with 25 μL Laemmli sample buffer and heated for 10 min at 90°C. After the injection of aliquots into the wells, electrophoresis was performed at 150 V, followed by staining with Coomassie blue R-250. Finally, the molecular weight of the sample was determined by comparing it to the standard band.
3. RESULTS AND DISCUSSION
3.1. Proximate analysis
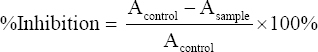
The Canary nut in testa [Figure 1a] was pre-processed before being used to produce protein hydrolysate. The processes are roasting, removing testa, and pressing, including all steps in the production of defatted canary kernels [Figure 2]. Furthermore, the proximate compositions of the samples are listed in Table 2, and a comparison of the processed canary compositions is shown in Figure 3.
 | Figure 1: Canary (Canarium indicum L.) nut. (a). Canary Nut in Testa (NIT) (b). Canary kernel (c). Roasted canary kernel (d). Defatted canary kernel (powder). [Click here to view] |
 | Figure 2: Preparation of the Canary (Canarium indicum L.) seed. [Click here to view] |
Table 2: Proximate compositions of canary (Canarium indicum L.).
| Samples | Moisture Content (%) | Fat (%) | Protein (%) | Crude Fiber (%) | Ash (%) | Carbohydrate | Energy (Kal/100 g) |
|---|---|---|---|---|---|---|---|
| Canary kernel | 3.492±0.071b | 67.502±0.058c | 12.611±0.061a | 8.459±0.024b | 3.615±0.019a | 4.320±0.052b | 681.377±0.578c |
| Roasted canary kernel | 2.239±0.204a | 63.224±0.147b | 13.650±0.332b | 11.358±0.169c | 3.583±0.043a | 5.946±0.557c | 653.353±0.599b |
| Defatted canary kernel (powder) | 3.331±0.044b | 45.439±0.038a | 36.039±0.003c | 3.204±0.249a | 10.781±0.116b | 1.206±0.142a | 569.749±0.878a |
*a-c within column, least square means without a common superscript differ (p < 0.05)
 | Figure 3: Proximate composition in processed Canarium indicum L. [Click here to view] |
The most abundant components in the samples (canary kernel [Figure 2b], roasted canary kernel [Figure 2c], and defatted canary kernel [Figure 2d]) were fat and protein. However, protein, moisture, and ash levels increased after processing (roasting, pressing, and grinding). As shown in Figure 3, proteins are the composition with a higher increase in the defatted canary seed (from 12% to 36%), implying that the canary pressing procedure increases the proportion of protein in the samples. According to Xing et al., Melo et al., Filho and Egea [5,21,22], fat removal’s mechanical pressing process enriches protein and eliminates other non-protein matrices. Protein yield was significantly higher in deffated canary kernel (36.039 ± 0.003%) compared to canary kernel (12.611 ± 0.061%, P < 0.05) and roasted canary kernel (13.650 ± 0.332%, P < 0.05). Furthermore, the protein content of the roasted canary kernel was significantly higher than the canary kernel (P < 0.05). The defatted canary kernel significantly (P < 0.05) has more enormous mineral resources than the canary seed/kernel [Figure 3]. The defatting process causes the sample to have a higher ash concentration [21,23,24].
As a result of the pressing process, the content of most nutrients (fat, fiber, and carbs) was significantly reduced (P < 0.05). Unlike moisture content, the value of the water component in the defatted canary kernel (powder) is increased since the powder form has a higher hygroscopicity than entire kernels [25-27]. This allows the defatted canary sample to absorb moisture from the environment more readily. Therefore, extra caution is needed while storing ground samples to avoid moisture reabsorption, leading to microbial contamination (bacteria, molds, and yeasts) [26,28].
3.2. Protein Content of Canarium Protein Hydrolysate
Lowry’s technique was used to determine the protein content of the hydrolysate. The dissolved protein in a hydrolysate solution is measured using this approach. Meanwhile, Cu2+ (CuSO4) binds to peptide bonds (O=C-N-H) under alkaline conditions, reducing it to Cu. The folin phenol reagent (phosphomolybdic-phosphotungstic acid) interacts with Cu ions, resulting in a blue-green complex that can be measured using a wavelength of 650–750 nm [29-31]. According to the Lowry method’s analysis results in Table 3, different protein content values were acquired from three enzymes, namely, papain, flavourzyme, and pepsin. The protein content of hydrolysate generated by flavourzyme (2.608–4.151 mg/mL) and pepsin (0.871–6.802 mg/mL) was statistically insignificant (P > 0.05). In contrast, the protein hydrolysate produced by papain had higher concentrations (21.805–38.334 mg/mL). This indicates that there was a statistically significant difference (P < 0.05) between hydrolysates hydrolyzed by papain and those produced by flavourzyme and pepsin.
Table 3: Protein concentration of canary (Canarium indicum L.) protein hydrolysate under varied conditions (type of enzyme, time, [E/S], and temperature).
| Code | Protein Content (mg/mL) | Code | Protein Content (mg/mL) | Code | Protein Content (mg/mL) |
|---|---|---|---|---|---|
| A1 | 38.107±0.464 | B1 | 2.608±0.026 | C1 | 4.492±0.238 |
| A2 | 32.998±0.493 | B2 | 2.364±0.061 | C2 | 5.133±0.161 |
| A3 | 32.658±0.157 | B3 | 3.232±0.034 | C3 | 5.985±0.541 |
| A4 | 27.981±0.851 | B4 | 3.958±0.225 | C4 | 5.230±0.277 |
| A5 | 30.206±0.587 | B5 | 2.988±0.049 | C5 | 3.533±0.786 |
| A6 | 35.905±0.275 | B6 | 3.016±0.035 | C6 | 2.931±0.435 |
| A7 | 28.321±0.312 | B7 | 2.148±0.130 | C7 | 2.789±0.648 |
| A8 | 32.340±0.236 | B8 | 3.221±0.055 | C8 | 3.839±0.832 |
| A9 | 28.775±0.258 | B9 | 3.255±0.020 | C9 | 4.674±0.310 |
| A10 | 38.334±0.605* | B10 | 2.114±0.130 | C10 | 2.085±0.378 |
| A11 | 34.270±0.669 | B11 | 4.151±0.129* | C11 | 3.170±0.225 |
| A12 | 36.972±0.360 | B12 | 3.794±0.475 | C12 | 4.151±0.665 |
| A13 | 27.527±0.416 | B13 | 3.215±0.123 | C13 | 3.164±0.789 |
| A14 | 21.805±0.239 | B14 | 3.731±0.309 | C14 | 0.871±0.084 |
| A15 | 34.996±0.477 | B15 | 2.982±0.130 | C15 | 6.802±0.035* |
| A16 | 35.201±0.360 | B16 | 3.067±0.064 | C16 | 5.729±0.351 |
| A17 | 33.067±0.807 | B17 | 2.273±0.121 | C17 | 2.977±0.491 |
According to the 3D surface response graph in Figure 4, the optimal model for maximizing protein hydrolysate production created by papain and flavourzyme is linear. On the other hand, pepsin’s protein hydrolysate follows a quadratic model. The enzyme concentration factor ([E/S]) was discovered to be a significant (P < 0.05) factor impacting the protein content of the overall hydrolysate produced by the three enzymes in the analysis of variance (ANOVA). However, time hydrolysis and temperature were statistically insignificant (P > 0.05) due to the narrowness of the two components’ ranges.
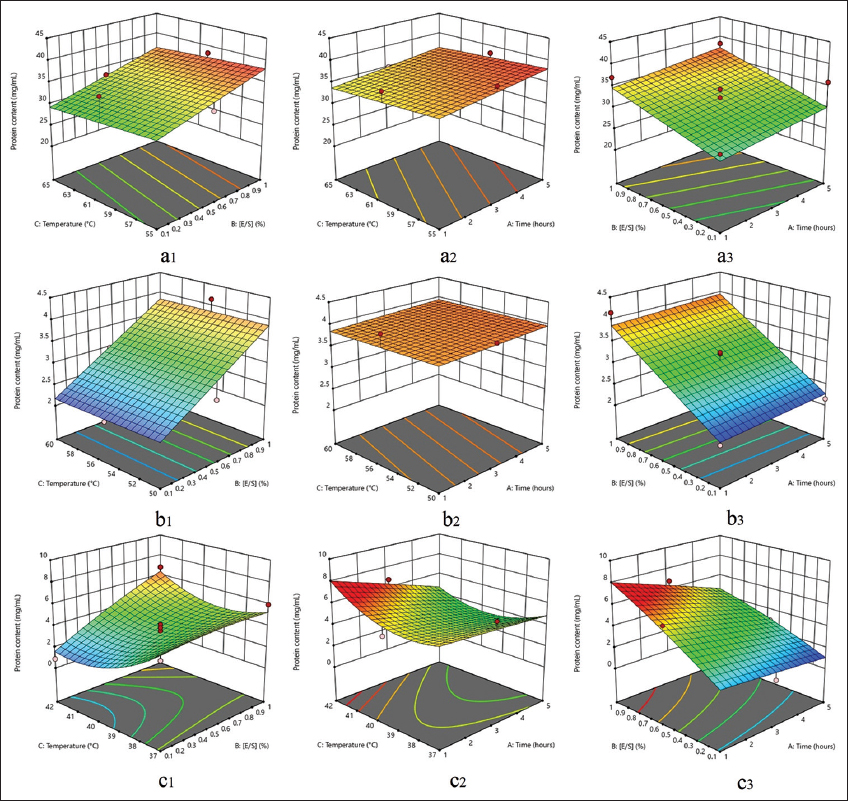 | Figure 4: Two parameters affect the 3D surface response protein content (mg/mL). (a1). Papain: temperature and [E/S]; (a2). Papain: temperature and time; (a3). Papain: [E/S] and time; (b1). Flavourzyme: temperature and [E/S]; (b2). Flavourzyme: temperature and time; (b3). Flavourzyme: [E/S] and time; (c1). Pepsin: temperature and [E/S]; (c2). Pepsin: temperature and time; (c3). Pepsin: [E/S] and time. [Click here to view] |
In protein hydrolysate production using papain, flavourzyme, and pepsin, the ideal condition that achieves maximum protein content is coded A10, B11, and C15, respectively. The measured protein content is proportional to the number of peptide bonds in the sample, influenced by enzyme activity in hydrolyzing the existing protein into lower molecular weight fragments. Several factors that play a role in the performance of proteases as biocatalysts include hydrogen ion concentration (pH), temperature [32-34], substrate and enzyme concentration [35], enzyme activator, and inhibitor [36].
3.3. DH
The DH was calculated to determine the number of peptide bonds cleavaged in the protein hydrolysate due to the proteolysis process (in this case enzymatically) [37,38]. Furthermore, the percentage of peptide bonds broken during the hydrolysis process divided by the total number in the protein substrate is known as the DH [39]. This research used the Ninhydrin method to detect the amount of α-amino nitrogen in protein hydrolysate. The principle is that the reaction between the ninhydrin reagent and the amino group was used to quantify the number of α-amino nitrogen in protein hydrolysate [37,40]. The purple-blue color produced by the complex formed between Ninhydrin and the primary α-amino group is known as “Ruhemann’s purple,” and its intensity was measured at a wavelength of 570 nm. In addition, the intensity observed in the sample is related to the quantity of primary α-amino acids present [41]. Table 4 shows the DH measured in the samples of C. indicum L.
Table 4: Hydrolysis degree of canary (Canarium indicum L.) protein hydrolysate under varied conditions (type of enzyme, time, [E/S], and temperature)
| Code | Degree of hydrolysis (%) | Code | Degree of hydrolysis (%) | Code | Degree of hydrolysis (%) |
|---|---|---|---|---|---|
| A1 | 11.345±0.534 | B1 | 16.009±0.231 | C1 | 2.237±0.060 |
| A2 | 4.137±0.029 | B2 | 4.733±0.026 | C2 | 3.122±0.085 |
| A3 | 9.447±0.193 | B3 | 16.769±0.122 | C3 | 3.301±0.065 |
| A4 | 8.860±0.177 | B4 | 21.935±0.177 | C4 | 3.164±0.092 |
| A5 | 10.955±0.060 | B5 | 15.225±0.174 | C5 | 3.055±0.003 |
| A6 | 13.278±0.241 | B6 | 15.984±0.062 | C6 | 1.335±0.010 |
| A7 | 8.632±0.060 | B7 | 4.002±0.095 | C7 | 2.817±0.071 |
| A8 | 12.541±0.347 | B8 | 16.329±0.083 | C8 | 3.117±0.085 |
| A9 | 4.137±0.029 | B9 | 16.154±0.043 | C9 | 3.499±0.096 |
| A10 | 23.140±0.320* | B10 | 4.175±0.045 | C10 | 2.796±0.082 |
| A11 | 11.814±0.099 | B11 | 17.183±0.162 | C11 | 2.896±0.046 |
| A12 | 13.525±0.294 | B12 | 22.753±0.265* | C12 | 3.257±0.034 |
| A13 | 9.875±0.223 | B13 | 15.879±0.061 | C13 | 3.842±0.102* |
| A14 | 12.704±0.464 | B14 | 16.489±0.165 | C14 | 2.830±0.057 |
| A15 | 20.699±0.256 | B15 | 5.558±0.036 | C15 | 3.513±0.096 |
| A16 | 10.765±0.163 | B16 | 9.256±0.125 | C16 | 2.889±0.111 |
| A17 | 13.259±0.919 | B17 | 3.624±0.052 | C17 | 3.322±0.018 |
The DH content of canary protein hydrolysate prepared with papain, flavourzyme, and pepsin ranged from 1.335% to 23.140%. According to the statistical results, pepsin treatment showed the lowest DH level (P < 0.05, significant difference). In comparison, the DH levels in the papain and flavourzyme treatments were statistically similar (P > 0.05). Several factors determine the difference in DH values on the same substrate (Canarium protein). However, the enzyme type is an essential determinant of DH and the resulting protein fragments [40]. Due to variances in enzyme specificity, each has varying proteolytic activity on the same substrate [42]. This is directly connected to the affinity of the substrate for the catalytic site. Exopeptidases and endopeptidases are two types of proteases, depending on where the enzyme is located [43]. Due to its catalytic site, papain belongs to the cysteine protease group of endopeptidases. Cysteine proteases have a Cys-His-Asn triad at the active site [44]. Flavourzyme is a combination of exopeptidase [45] and endopeptidase [46], a type of protease that hydrolyzes peptide bonds at the N- or C-terminal ends of protein chains [43,47]. The dual-action mechanism of flavourzyme in cleaving peptide chains enables the average value of DH flavourzyme to be higher than other enzymes with different treatments. On the other hand, Pepsin functions by cleaving internal peptide bonds (endopeptidase) [48], a member of the aspartic protease subclass. The aspartic acid residues in this subclass have two catalytic regions, including Asp-Thr-Gly-Ser in the N terminal domain and a matching Asp-Thr-Gly-Ser/Thr in the C terminal domain [49].
Figure 5 shows that the optimal DH using papain is obtained through a linear model. In contrast, flavourzyme uses a quadratic model, and pepsin utilizes a 2FI (two-factor interaction) model. The three variable factors in the production of protein hydrolysates using papain and flavourzyme, namely, time, substrate concentration ([E/S]), and temperature, were statistically significant (P < 0.05) in altering the DH. In pepsin (2FI model), the interaction between hydrolysis time and substrate concentration was the most significant factor (P < 0.05) affecting the DH produced. Based on the test results, samples with codes A10 (23.140%), B12 (22.753%), and C13 (3.842%) had the maximum DH produced using papain, flavourzyme, and pepsin, respectively.
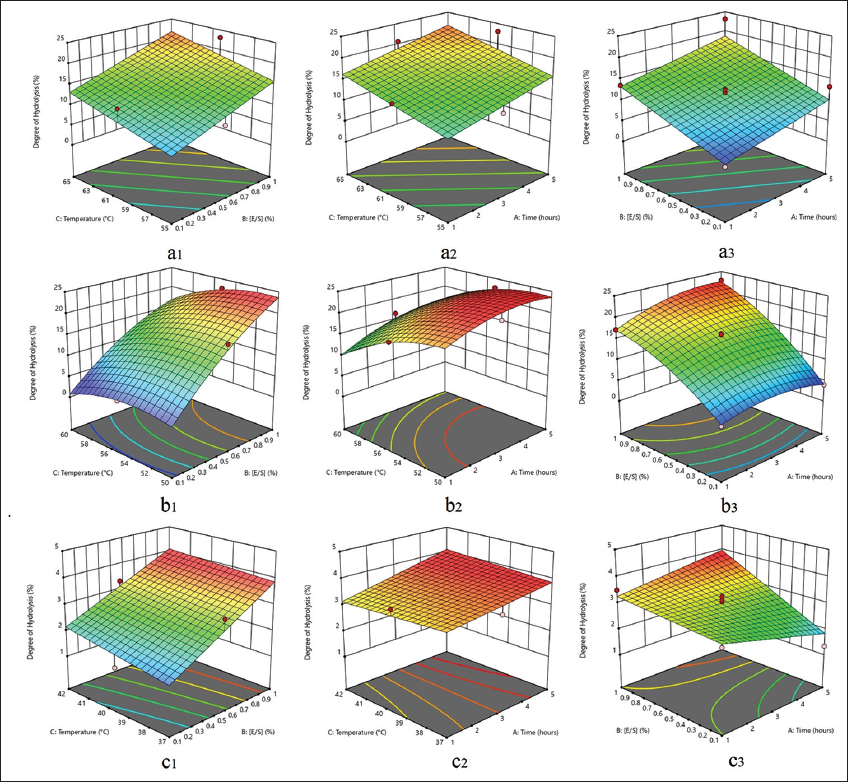 | Figure 5: 3D surface response degree of hydrolysis (%) affected by two parameters. (a1). Papain: temperature and [E/S]; (a2). Papain: temperature and time; (a3). Papain: [E/S] and time; (b1). Flavourzyme: temperature and [E/S]; (b2). Flavourzyme: temperature and time; (b3). Flavourzyme: [E/S] and time; (c1). Pepsin: temperature and [E/S]; (c2). Pepsin: temperature and time; (c3). Pepsin: [E/S] and time. [Click here to view] |
3.4. Antioxidant Activity
Antioxidant activity is used as a decision-making parameter to select the most optimum production process. This is defined by protein hydrolysate production with a more excellent antioxidant activity (lowest IC50 value) [50]. The DPPH free radical scavenging method was used to conduct the antioxidant tests. Furthermore, the DPPH is a highly stable free radical chromogen with maximal absorbance at 515 nm (purple color) [51]. Its reaction with antioxidants was observed through decreased absorbance due to DPPH reduction and a color change from purple to yellowish [52-54].
The data in Table 5 were used to perform statistical calculations. Each group of protein hydrolysate produced by different enzymes, such as papain, flavourzyme, and pepsin, showed a statistically significant mean value (P < 0.05) for DPPH radical scavenging activity. According to the post hoc test, each of the three enzymes has a distinct subset. Based on ANOVA, the enzyme concentration factor (E/S) and hydrolysis temperature had a significant influence (P < 0.05) on the antioxidant activity of the final product. In contrast, hydrolysis duration had no significant effect (P > 0.05).
Table 5: Antioxidant activity of canary (Canarium indicum L.) protein hydrolysate under various conditions, such as type of enzyme, time, [E/S], and temperature).
| Code | IC50 (mg/mL) | Code | IC50 (mg/mL) | Code | IC50 (mg/mL) |
|---|---|---|---|---|---|
| A1 | 3.803±0.213 | B1 | 0.426±0.008* | C1 | 1.136±0.088 |
| A2 | 4.794±0.034 | B2 | 0.555±0.021 | C2 | 1.102±0.043 |
| A3 | 3.918±0.029 | B3 | 0.457±0.022 | C3 | 1.374±0.045 |
| A4 | 3.640±0.015 | B4 | 0.438±0.050 | C4 | 1.279±0.106 |
| A5 | 3.184±0.112 | B5 | 0.658±0.099 | C5 | 0.794±0.016 |
| A6 | 3.230±0.051 | B6 | 0.605±0.057 | C6 | 0.642±0.032 |
| A7 | 3.503±0.016 | B7 | 0.529±0.009 | C7 | 0.627±0.033 |
| A8 | 3.189±0.017 | B8 | 0.624±0.017 | C8 | 0.745±0.017 |
| A9 | 3.968±0.060 | B9 | 0.578±0.018 | C9 | 0.863±0.020 |
| A10 | 3.338±0.117 | B10 | 0.611±0.010 | C10 | 0.402±0.012 |
| A11 | 3.271±0.115 | B11 | 0.752±0.007 | C11 | 0.605±0.014 |
| A12 | 3.087±0.116 | B12 | 0.644±0.065 | C12 | 0.632±0.009 |
| A13 | 2.622±0.072* | B13 | 0.673±0.012 | C13 | 0.631±0.025 |
| A14 | 4.151±0.066 | B14 | 0.777±0.008 | C14 | 0.195±0.001* |
| A15 | 3.242±0.182 | B15 | 0.668±0.023 | C15 | 1.523±0.010 |
| A16 | 3.885±0.244 | B16 | 0.671±0.016 | C16 | 1.081±0.014 |
| A17 | 3.197±0.068 | B17 | 0.610±0.007 | C17 | 0.637±0.035 |
The response surface model was plotted according to the minimum function of the IC50 value. The best optimization model for canary protein hydrolysate generated with papain and pepsin is quadratic, while the linear model is better for flavourzyme. Meanwhile, within a 95% confidence interval, enzyme concentration ([E/S]) and hydrolysis temperature had the most significant effect on antioxidant activity (IC50). The antioxidant activity of protein hydrolysates generated from papain and pepsin was significantly affected by enzyme concentration (ratio [E/S]). At the same time, the hydrolysis temperature had a significant effect on the synthesis with flavourzyme and papain (P < 0.05).
Figure 6a1-a3 shows that the antioxidant activity (IC50) of papain protein hydrolysate (PH) is the lowest (2.622 mg/mL) at the highest ratio [E/S], indicating that the hydrolysate product was the best to scavenge DPPH radicals (sample code A13). The best protein hydrolysate produced by pepsin is sample code B1 (0.426 mg/mL). Figure 6c1-c3 shows that the higher the ratio [E/S] and the lower the temperature, the lower the IC50 value. In flavourzyme, C14 shows the lowest IC50 value of the entire sample (0.195 mg/mL), the hydrolysis temperature is the factor that has a significant effect on the antioxidant activity, and this is shown in Figure 6b1-b3 the lowest hydrolysis temperature of 50ºC produce the lowest IC50 result (best antioxidant activity).
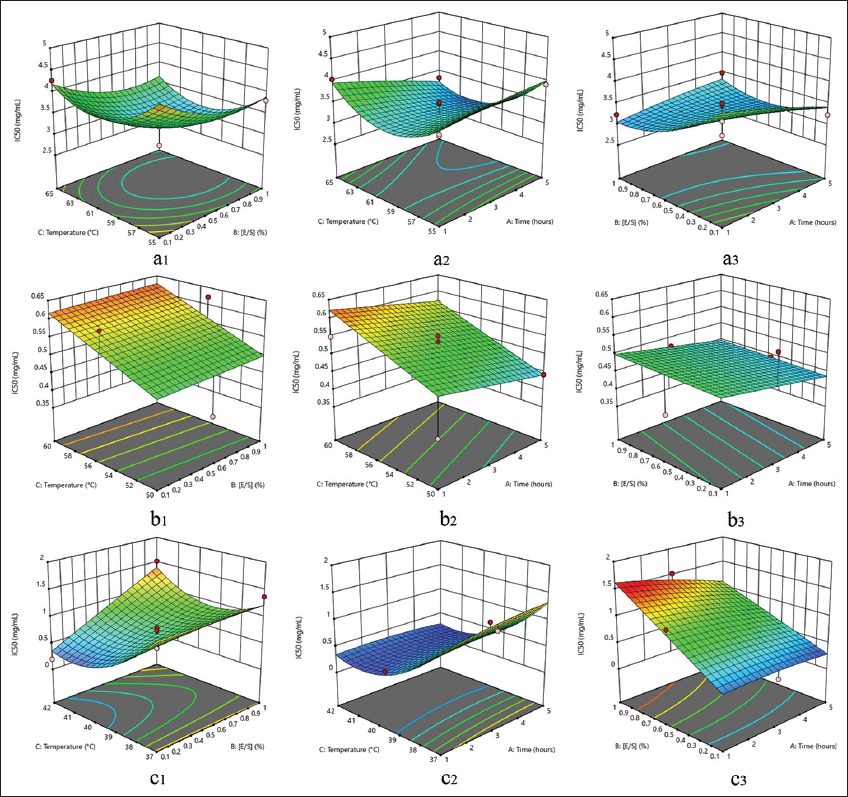 | Figure 6: 3D surface response antioxidant activity (IC50) (mg/mL) affected by two parameters. (a1). Papain: temperature and [E/S]; (a2). Papain: temperature and time; (a3). Papain: [E/S] and time; (b1). Flavourzyme: temperature and [E/S]; (b2). Flavourzyme: temperature and time; (b3). Flavourzyme: [E/S] and time; (c1). Pepsin: temperature and [E/S]; (c2). Pepsin: temperature and time; (c3). Pepsin: [E/S] and time. [Click here to view] |
The antioxidant activity of hydrolyzate is determined by peptide characteristics such as production process conditions, protease type, amino acid composition, amino acid sequence, peptide molecular structure, and peptide concentration [55,56]. Antioxidants’ method of action in scavenging DPPH radicals is known as single electron transfer (SET) or hydrogen atom transfer (HAT) [52,53]. Furthermore, aromatic amino acids perform the SET mechanism on radical scavenging by donating protons to electron-deficient radical entities and stabilizing them through electron resonance processes. On the other hand, the amino acids Asp and His operates as HAT since they have carboxylic and amino groups on their side [3].
3.5. SDS-PAGE
SDS-PAGE analysis was performed to determine the fragment ladder pattern on protein hydrolysate samples prepared with different treatments. Figures 7-9 showed the characteristics of protein hydrolysates prepared with papain, flavourzyme, and pepsin, respectively. The primary band appeared in the sample codes A2 and A9 at 20 kDa in various protein hydrolysates produced by papain [Figure 7], while the protein flavourzyme band appeared in the range of 10–35 kDa [Figure 8]. The main protein band in the hydrolysate formed by pepsin ranged from 10 kDa to 20 kDa [Figure 9]. Practically, no protein bands were observed on the electropherogram of the papain hydrolysate sample. Furthermore, the absence of protein bands shows that almost all large molecular weight proteins had been digested into peptide fragments of molecular weight <10 kDa. This result is consistent with [57], stating that hydrolysis of ovotransferrin yielded papain peptides of MW<10 kDa.
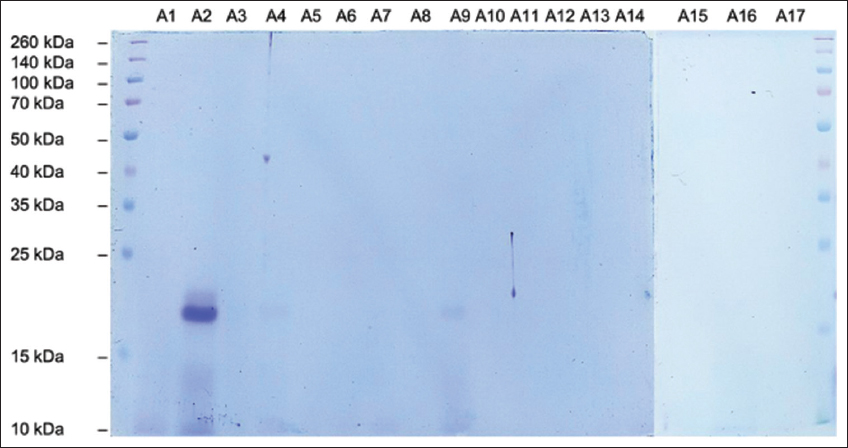 | Figure 7: SDS-PAGE electropherograms of Canarium indicum L. protein hydrolysate produced by papain (Sample Code A1-A17). [Click here to view] |
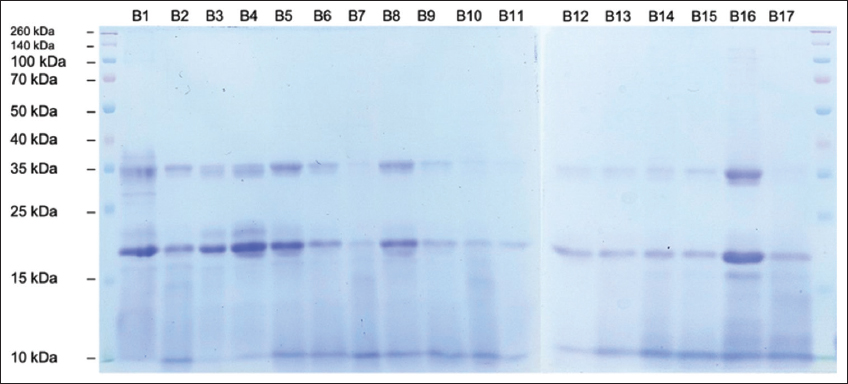 | Figure 8: SDS-PAGE electropherograms of Canarium indicum L. protein hydrolysate produced by flavourzyme (Sample Code B1-B17). [Click here to view] |
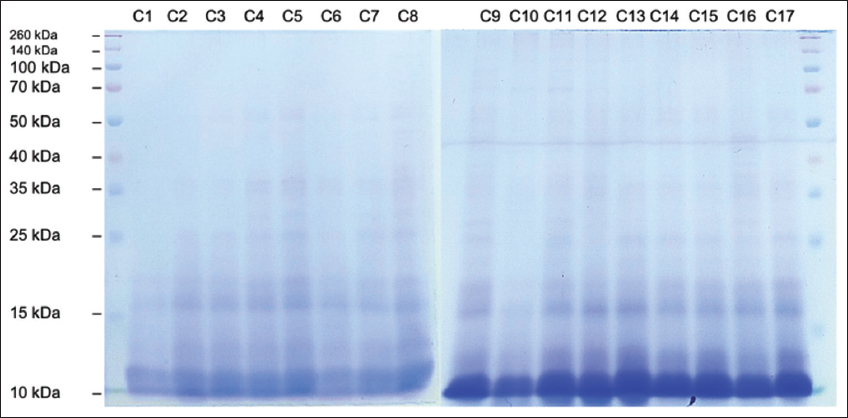 | Figure 9: SDS-PAGE electropherograms of Canarium indicum L. protein hydrolysate produced by pepsin (Sample Code C1-C17). [Click here to view] |
The effect of catalytic sites of each enzyme has a significant impact on the termination pattern of the protease peptide bond to the protein substrate. As previously stated, papain is an endolytic cysteine protease, flavourzyme is a mixture of exo- and endopeptidase, while pepsin is an aspartic protease (endopeptidase). Papain functions as an endopeptidase, amidase, and esterase enzyme. It tends to break peptide bonds containing leucine, glycine, basic amino acids (particularly arginine lysine), and phenylalanine [58,59]. Furthermore, papain cleaves peptide bonds with hydrophobic side groups (Bulky aromatic residue) [60,61]. The enzyme (aspartic protease), such as pepsin, is the most effective in breaking the peptide bonds between hydrophobic amino acids and, preferably, aromatic amino acids (phenylalanine, tryptophan, and tyrosine) [62]. Meanwhile, flavourzyme, a leucyl aminopeptidase, exhibits endo- and exopeptidase activity. Hydrolysis produces N-terminal amino acids, preferentially Leucine, Glutamic acid, and Glycine [63].
4. CONCLUSION
Samples A13, B1, and C14 produced the best antioxidant protein hydrolysate using papain, flavourzyme, and pepsin enzymes. A papain concentration of 0.55 % (w/v), at a temperature of 60°C, and a hydrolysis period of 3 h were used to make antioxidative protein hydrolysate. The optimal condition for producing antioxidative protein hydrolysate with flavourzyme was achieved by hydrolysis for 1 h at 50°C with a 0.55% (v/v) enzyme concentration. Meanwhile, pepsin produced protein hydrolysate by hydrolyzing Canarium protein for 3 h at 42°C with 0.1% (w/v) enzyme concentration. The antioxidative activity (IC50) values of each hydrolysate were 2.622 ± 0.072 (A13), 0.426 ± 0.008 (B1), and 0.195 ± 0.001 mg/mL (C14).
5. ACKNOWLEDGMENT
The authors are grateful to the Master Education Scholarship Toward Doctorate for Excellent Undergraduates (PMDSU) organized by the Directorate General of Higher Education Ministry of Education and Culture Indonesia for the fund.
6. AUTHORS’ CONTRIBUTIONS
All authors contributed significantly to the conception and design, data acquisition, analysis, and interpretation, participated in the drafting of the article or critically revised it for significant intellectual content, agreed to submit it to the current journal, gave final approval of the version to be published, and agreed to be accountable for all aspects of the work.
7. FUNDING
This research was funded by the Directorate General of Higher Education Ministry of Education and Culture Indonesia.
8. CONFLICTS OF INTEREST
The authors declare that there are no conflicts of interest.
9. ETHICAL APPROVALS
This study does not involve experiments on animals or human subjects.
10. DATA AVAILABILITY
All data generated and analyzed are included within this research article.
11. PUBLISHER’S NOTE
This journal remains neutral with regard to jurisdictional claims in published institutional affiliation.
REFERENCES
1. Chalamaiah M, Kumar BD, Hemalatha R, Jyothirmayi T. Fish protein hydrolysates:Proximate composition, amino acid composition, antioxidant activities and applications:A review. Food Chem 2012;135:3020-38. [CrossRef]
2. Carvajal AK, Mozuraityte R. Fish oils:Production and properties. In:Encyclopedia of Food and Health. United States:Academic Press;2016. 693-8. [CrossRef]
3. Sarmadi BH, Ismail A. Antioxidative peptides from food proteins. A review. Peptides 2010;31:1949-56. [CrossRef]
4. Yusnaini, Suryanto E, Hasan S, Wulansari A, Dewi EK. The Characteristics of Volatile Compounds of Kenari (
5. Xing Q, Wit M, Kyriakopoulou K, Boom RM, Schutyser MA. Protein enrichment of defatted soybean flour by fine milling and electrostatic separation. Innov Food Sci Emerg Technol 2018;50:42-9. [CrossRef]
6. Sandakabatu D, Diarra SS. Canarium (
7. Maldonado J, Gil A, Narbona E, Molina JA. Special formulas in infant nutrition:A review. Early Hum Dev 1998;53:S23-32. [CrossRef]
8. Association of Official Analytical Chemist. Official Methods of Analysis. 17th ed. The Association of Official Analytical Chemist, Gaithersburg, MD, USA:Association of Official Analytical Chemist;2000.
9. Markwell MA, Haas SM, Bieber LL, Tolbert NE. A modification of the Lowry procedure to simplify protein determination in membrane and lipoprotein samples. Anal Biochem 1978;87:206-10. [CrossRef]
10. Lucas AD, Tomazic-Jezic VJ. Modification of the Lowry method for analysis of soluble latex proteins. Toxicol Methods 2000;10:165-79. [CrossRef]
11. Nwachukwu ID, Aluko RE. A systematic evaluation of various methods for quantifying food protein hydrolysate peptides. Food Chem 2019;270:25-31. [CrossRef]
12. Moore S, Stein WH. A modified ninhydrin reagent for photometric determination of amino acids and related compounds. J Biol Chem 1954;211:907-13. [CrossRef]
13. Pearce KN, Karahalios D, Friedman M. Ninhydrin assay for proteolysis in ripening cheese. J Food Sci 1988;53:432-8. [CrossRef]
14. Zhang Y, Fu Y, Zhou S, Kang L, Li C. A straightforward ninhydrin-based method for collagenase activity and inhibitor screening of collagenase using spectrophotometry. Anal Biochem 2013;437:46-8. [CrossRef]
15. Zhang SB, Wang Z, Xu SY, Gao XF. Purification and characterisation of a radical scavenging peptide from rapeseed protein hydrolysates. J Am Oil Chem Soc 2009;86:959-66. [CrossRef]
16. He R, Ju X, Yuan J, Wang L, Girgih AT, Aluko RE. Antioxidant activities of rapeseed peptides produced by solid state fermentation. Food Res Int 2012;49:432-8. [CrossRef]
17. Yarnpakdee S, Benjakul S, Kristinsson HG, Kishimura H. Antioxidant and sensory properties of protein hydrolysate derived from Nile tilapia (
18. Erdo?an MK, Geçibesler IH, Behçet L. Chemical constituents, antioxidant, antiproliferative and apoptotic effects of a new endemic
19. Nazari B, Mohammadifar MA, Shojaee-Aliabadi S, Feizollahi E, Mirmoghtadaie L. Effect of ultrasound treatments on functional properties and structure of millet protein concentrate. Ultrasonics Sonochem 2018;41:382-8. [CrossRef]
20. Chaquilla-Quilca G, Balandran-Quintana RR, Huerta-Ocampo JA, Montfort GR, Luna-Valdez JG. Identification of proteins contained in aqueous extracts of wheat bran through a proteomic approach. J Cereal Sci 2018;80:31-6. [CrossRef]
21. Melo D, OrtíMA, Nunes MA, Costa AS, Machado S, Alves RC,
22. Filho JG, Egea MB.
23. Teh SS, Bekhit AE, Carne A, Birch J. Effect of the defatting process, acid and alkali extraction on the physicochemical and functional properties of hemp, flax and canola seed cake protein isolates. J Food Measure Character 2013;8:9168. [CrossRef]
24. Naik HR, Sekhon KS. Influence of defatted soy flour addition on the quality and stability of pretzel type product. J Food Sci Technol 2014;51:571-6. [CrossRef]
25. Mulyati AH, Widiastuti D, Oktaviani LM. Characterization of durian seed flour (
26. Pombo JC, Carmo JR, Araújo AL, Medeiros HH, Pena RS. Moisture sorption behaviour of Cupuassu powder. Open Food Sci J 2018;13:73. [CrossRef]
27. Astuti SD, Lestari S, Erminawati, Widarni S, Wijanarko G, Wibawa FN. Shelf life prediction of Carica seeds powder using accelerated method. IOP Conf Ser Earth Environ Sci 2021;653:012055. [CrossRef]
28. Jung H, Lee YJ, Yoon WB. Effect of moisture content on the grinding process and powder properties in food:A review. Processes 2018;6:69. [CrossRef]
29. Noble JE, Bailey MJ. Quantitation of protein. Methods Enzymol 2009;463:73-95. [CrossRef]
30. Schaich KM. Analysis of lipid and protein oxidation in fats, oils, and foods. In:Oxidative Stability and Shelf Life of Foods Containing Oils and Fats. Ch. 1. Netherlands:Elsevier;2016. [CrossRef]
31. Chen SH. Quantification and analysis of proteins. Diagnostic Molecular Biology. Ch. 8. Netherlands:Elsevier;2019. 187-214. [CrossRef]
32. Saied HM. Some Factors Affecting the Rate of Protease Catalysed Reactions. England:Applied Science Publishers Ltd.;1979.
33. Scopes RK. Enzyme activity and assays. In:Encyclopedia of Life Sciences. United States:Macmillan Publishers Ltd., Nature Publishing Group;2002. [CrossRef]
34. Grahame D, Bryksa BC, Yada R. Factors affecting enzyme activity. In:Improving and Tailoring Enzymes for Food Quality and Functionality. Netherlands:Elsevier;2015. 11-55. [CrossRef]
35. Robinson PK. Enzymes:Principles and biotechnological applications. Essays Biochem 2015;59:75. [CrossRef]
36. Lopina OD. Open access peer-reviewed chapter. In:Enzyme Inhibitors and Activators. India:IntechOpen;2017. [CrossRef]
37. Rutherfurd SM. Methodology for determining degree of hydrolysis of proteins in hydrolysates:A review. J AOAC Int 2010;93:1515-22. [CrossRef]
38. Aspmo SI, Horn SJ, Eijsink VG. Enzymatic hydrolysis of Atlantic cod (
39. Bougatef A, Balti R, Haddar A, Jellouli K, Souissi N, Nasri M. Antioxidant and functional properties of protein hydrolysates of bluefin tuna (
40. Cho DY, Jo K, Cho SY, Kim JM, Lim K, Suh HJ,
41. Perrett D, Nayuni NK. Efficacy of current and novel cleaning technologies (ProReveal) for assessing protein contamination on surgical instruments. In:Decontamination in Hospitals and Healthcare. 2nd ed. Sawston, United Kingdom:Woodhead Publishing;2014. 598-619. [CrossRef]
42. Leni G, Soetemans L, Jacobs J, Depraetere S, Gianotten N, Bastiaens L,
43. Mótyán JA, Tóth F, T?zsér J. Research applications of proteolytic enzymes in molecular biology. Biomolecules 2013;3:923-42. [CrossRef]
44. Verma S, Dixit R, Pandey KC. Cysteine proteases:Modes of activation and future prospects as pharmacological targets. Front Pharmacol 2016;7:107. [CrossRef]
45. P?ksa A, Miedzianka J. Amino acid composition of enzymatically hydrolysed potato protein preparations. Czech J Food Sci 2014;32:265-72. [CrossRef]
46. Silva CM, Fonseca RA, Prentice C. Comparing the hydrolysis degree of industrialization byproducts of Withemouth croaker (
47. Phongthai S, Singsaeng N, Nhoo-Ied R, Suwannatrai T, Schönlechner R, Unban K,
48. Yegin S, Dekker P. Progress in the field of aspartic proteinases in cheese manufacturing:Structures, functions, catalytic mechanism, inhibition, and engineering. Dairy Sci Technol EDP Sci 2013;93:565-94. [CrossRef]
49. Mutlu A, Gal S. Plant aspartic proteinases:Enzymes on the way to a function. Physiol Plant 1999;105:569-76. [CrossRef]
50. Rivero-Cruz JF, Granados-Pineda J, Pedraza-Chaverri J, Pérez-Rojas JM, Kumar-Passari A, Diaz-Ruiz G,
51. Apak R, O?zyu?rek M, Gu?c?lu? K, C?apanog?lu E. Antioxidant activity/capacity measurement. 1. Classification, physicochemical principles, mechanisms, and electron transfer (ET)-based assays. J Agric Food Chem 2016;64:997-1027. [CrossRef]
52. Prior RL, Wu X, Schaich K. Standardized methods for the determination of antioxidant capacity and phenolics in foods and dietary supplements. J Agric Food Chem 2005;53:4290-302. [CrossRef]
53. Liang ND, Kitts DD. Antioxidant property of coffee components:Assessment of methods that define mechanisms of action. Molecules 2014;19:19180-208. [CrossRef]
54. Geçibesler IH, Behcet L, Erdogan MK, Ask?n H. Antioxidant potencies and chemical compositions of essential oils of two endemic species grow in Turkey:Astragalus oocephalus subsp.
55. Yu HC, Tan FJ. Optimization of ultrasonic-assisted enzymatic hydrolysis conditions for the production of antioxidant hydrolysates from porcine liver by using response surface methodology. Asian Aust J Anim Sci 2017;30:1612-9. [CrossRef]
56. Pan M, Liu K, Yang J, Liu S, Wang S, Wang S. Advances on food-derived peptidic antioxidants-a review. Antioxidants 2020;9:799. [CrossRef]
57. Rathnapala EC, Ahn DU, Abeyrathne ED. Enzymatic hydrolysis of ovotransferrin and the functional properties of its hydrolysates. Food Sci Anim Resour 2021;41:608-22. [CrossRef]
58. Amri E, Mamboya F. Papain, a plant enzyme of biological importance:A review. Am J Biochem Biotechnol 2012;8:99-104. [CrossRef]
59. Carrey EA. In:Creighton TE, editor. Protein Structure:A Practical Approach. 2nd ed. New York:IRL Press;1997. 117-44.
60. Kamphuis IG, Drenth J, Baker EN. Thiol proteases:Comparative studies based on the high-resolution structures of papain and actinidin, and on amino acid sequence information for cathepsins B and H, and stem bromelain. J Mol Biol 1985;182:317-29. [CrossRef]
61. Yazawa K, Numata K. Recent advances in chemoenzymatic peptide syntheses. Molecules 2014;19:13755-74. [CrossRef]
62. Antonov VK, Rumsh LD, Tikhodeeva AG. Kinetics of pepsin-catalysed transpeptidation:Evidence for the “amino-enzyme“intermediate. FEBS Lett 1974;46:29-33. [CrossRef]
63. Huang S, Zhao L, Cai X, Wang S, Huang Y, Hong J,