
1. INTRODUCTION
Several products from natural origins have given us different biologically important molecules that provide a good template for synthetic novel drugs. Flavonoids, yellow shaded auxiliary metabolites, are normally found in blossoms, natural products, seeds, leaves, bark, olive oil, tea, and red wine. Flavonoids are now known to have numerous gainful impacts on our body [1]. The main function of this secondary metabolite is to give protection against ultraviolet radiation, herbivore animals, and pathogen [2,3]. Quercetin (Q) is one of the significant organically dynamic flavonoids which has numerous (OH) hydroxyl bunches in its synthetic structure and gives various destinations to coordination with the change in metals [4]. The transition metal complexes formed with Q molecules enhance its pharmacological properties and are reported to possess antioxidant, antibacterial, cytotoxicity, antiplatelet, cardioprotective activities, etc. [5–7].
Copper is an important metal stored in every tissue of our body, but the primary storage organ is liver and some amount in the brain, kidney, muscles, heart, etc. Copper is an essential micronutrient (the concentration of total copper in the body is only 75–100 mg) required for various biological functions in our body [8]. If an imbalance in the concentration of copper in the body occurs, it will then lead to serious genetic health issues such as Menke’s diseases, Wilson’s diseases, and idiopathic copper toxicity [9]. Copper assumes a significant job in the creation of profoundly receptive OH radicals through the Haber–Weiss response [10]. In recent years, oxidation of organic compounds by copper and its complexes has attracted significant attention of scientists [11] and huge demand as a mild catalyst has been created [12]. Copper complexes have surely exhibited a wide range of pharmacological activities [13]. The present study explains the spectroscopic studies on the adduct formation using well-known flavonoid biomolecules Q, which are characterized using various modern analytical techniques. Q and copper II [Cu (II)] were in a solvent-free condition and no accelerating catalyst or added substances were used to advance the responses. The solvent-free synthesized complexes were checked for their activities as antioxidants, antimicrobial (Escherichia coli and Staphylococcus aureus), and cytotoxicity in MG-63 cells.
2. MATERIAL
All the reagents utilized were of analytical grade with no further decontamination. Q dihydrate, copper acetate, 2, 2?-bipyridine, 1, 10-phenanthroline, and 2, 2-Diphenyl-1-picrylhydrazyl (DPPH) were gained from Sigma Aldrich.
2.1. Measurements
The synthesized compounds were characterized by elemental examination (Euro EA Elemental Analyzer), Fourier transformation infrared spectroscopy (FTIR) (Perkin Elmer Spectrum version 10.4.3 spectrometer as KBr pellet, inside the scope of 400–4,000 cm−1), Ultraviolet (UV)–visible spectra (UV-1800 Shimadzu version 2.52 spectrophotometer utilizing 1 cm path-length quartz cuvettes, in the scope of 200–700 nm), and high-resolution mass spectroscopy (HRMS) study (time of flight mass spectrometry) (100–1,000). The antioxidant studies (DPPH method) and cytotoxicity assay were carried out on MG-63 cells, and enzymatic assay, nonenzymatic assay, and minimum inhibitory concentration (MIC) assay were carried out on E. coli and S. aureus bacteria. Here, Q itself is taken as a reference for comparison of the activity of complexes.
2.2. Preparation of Complex 1
2.2.1. General procedure for the blend of Q and copper (II) acetate complex in the solid-state supported with 2, 2?-bipyridal (Complex 1) and 1, 10-phenanthroline (Complex 2)
An accurately weighed amount of compounds was taken followed by grinding and employing a clean and dried mortar pestle at room temperature. The stoichiometry of all the ingredients for synthesized compounds, i.e., complex 1 and complex 2, was 1:1:1. Complex 1 (brown) was synthesized with Q (1 mmol), 2, 2?-bipyridal (1 mmol), and Cu (II) metal ions (1 mmol) by the solid-state trituration method. Q (1 mmol), 1, 10-phenanthroline (1 mmol), and Cu (II) metal ions (1 mmol) in the solid state were used for complex 2 (dark brown) syntheses by the same methodology. The change in color after trituration of the ingredient indicates the formation of a product which is further characterized by using different spectroscopic techniques.
Complex 1
C27H22CuN2O10 (598.0 g·mol−1): Yield: 96%, IR (KBr, cm-1): 3395.0 (?O-H), 1646.89 (?C = O), 1416.94 (?C-OH), 1538.00 (?C = N), 1276.48 (?C-O-C), 1172.00 (?CC + ?CCH), 838, 726 (?NCCH + ?CCCH). Elemental analysis: Expt. (Calc.) C% 54.19 (54.23), H% 3.69 (3.71), N% 4.65 (4.68). HRMS: Expt. (Calc.) 598.0138 (598.024) [(Q-H) + Cu (II) (Bpy) (AcO) (H2O)].
Complex 2
C29H22CuN2O10 (622.0 gmol−1): Yield: 95%, IR (KBr, cm-1): 3402.22 (?O-H), 1612.49 (?C = O), 1416.65 (?C-OH), 1567.64 (?C=N), 1266.30 (?C-O-C), 1168.53 (?CC + ?CCH), 825, 721 (?NCCH + ?CCCH). Elemental analysis: Expt. (Calc.) C% 55.95 (55.99), H% 3.51 (3.56), N% 4.47 (4.50). HRMS: Expt. (Calc.) 622.0091 (622.044) [(Q-H) + Cu (II) (Phen) (AcO) (H2O)].
2.3. Antioxidant Analysis (DPPH method)
The antioxidant assay was carried out based on the method reported earlier with little modifications [14]. DPPH radical examination gives a simple and quick approach to assess the antiradical exercises of cancer prevention agents. Assurance of the response active assortments DPPHH might be a result of the response between DPPH•-associated antioxidant:
(AH) = DPPH• + AH _ DPPHH + A•
The exchange of the reaction is assessed by adding DPPHH at the termination of the reaction. If there is an increase in the percentage of the remaining DPPH• at the level, the response is reversible, else, it is a whole response:
 | Scheme 1. Proposed scheme for complex 1 and complex 2 in the solvent-free phase. [Click here to view] |
DPPH free radical scavenging activity (%) = Ao−At/Ao × 100
where Ao = control absorbance l and At = test absorbance / standard sample.
2.4. In Vitro Antibacterial Activity
Minimum inhibitory concentration is outlined as the minimum concentration of medication at which the development was not obvious and was analyzed by a broth micro-dilution technique [15]. Each of the complexes (1 and 2) was tried against Gram-positive, for example, S. aureus (ATCC 29213), and Gram-negative, for example, E. coli (ATCC 25922), strain microorganisms. Seeding of the diluted bacterial culture of S. aureus and E. coli was carried out into 96-well plates at a convergence of 1 × 10⁵ CFU/ml and culture plates were brooded at 37°C for 24 hours with steady shaking. A test sample (1%) of the complexes and Q ligand was made in dimethyl sulfoxide (DMSO) solvent. After 24 hours, the culture plates were taken out from the incubator and cell thickness was estimated by taking absorbance at 600 nm in a microplate reader (Dynex Technologies, Chantilly, VA). MIC values in both microbes were analyzed in triplicate. Q itself was used as a positive control for comparing the activities of synthesized Cu complexes [16].
2.5. Cell Growth and Microscopy in Bacteria
Cell growth was studied by MTT {3-(4, 5-dimethylthiazol-2-yl)-2, 5-diphenyl-tetrazolium-bromide} test technique, and it was estimated by taking the absorbance. Cell growth was analyzed after 3, 5, and 7 days of microbial cell culture. In a 24-well plate, six gatherings of tests were incubated and after that cell suspension (1 ml) of viable cells was seeded on the test samples and incubated at 37°C with 5% CO2. Afterward, the plates were removed and washed twice using a phosphate buffered saline (PBS) solution. Test samples were included with 500 μl MTT solution and incubated at 37°C for 6 hours. After incubation, 500 μl DMSO (SRL, 28580, India) was added per well to breakdown the purple formazan and was blended altogether by pipetting the solution. The solution was incubated at 37°C for 10 minutes after that 96-well plates were used and 150 μl solutions were added to each well. All experimental trials were carried out in triplicate. Optical thickness (OD) was estimated at 595 nm utilizing an automated plate reader (ELISA Microplate Readers Bio-Rad). Cell viability was plotted as the level of the control esteem [17]. In the study, Q is used as a positive control and the anti-proliferative activities of the prepared complexes were compared [16]. The morphology of the microbial cells on the sample was seen with a confocal laser scanning microscopy (controlled low-strength material; Hitachi)
2.6. Cell Lysate Preparation
The cell lysate was set up by developing refined microbes and centrifuging at 4°C for 10 minutes at 5,000 rpm. The pellet produced by the centrifugation process was washed in PBS supersede by redissolving in lysate buffer containing lysozyme, and it was again incubated at 4°C for 4 hours and sonicated for 5 minutes. Again it was centrifuged at 10,000 rpm and then the cellular contents were removed and the supernatant was collected for enzymatic study [18].
2.7. Enzymatic and Nonenzymatic Techniques
 | [Click here to view] |
2.8. Superoxide Dismutase (SOD) Technique
The enzymatic test was conveyed by the decrease in nitro blue tetrazolium (NBT) [19]. Test sample tube, in each 3 ml reaction mixture, contained PBS (0.01 M, pH 7.8), 130 mm methionine, 60 μm riboflavin, 0.5 mm ethylenediamine tetraacetic acid, 0.75 mm NBT, and 0.5 ml of the test sample solution. Control tubes containing identical tube containing reaction mixture without the test sample solution was kept dim. The blank tube contained 0.01 M PBS. Absorbance was taken at 560 nm. The percentage inhibition of superoxide generation was estimated by looking at the absorbance of the control and test.
Calculation: GSH = OD (412 nm) / min × volume of measure × 100 / 1.36 of mole GSH conjugate / g time
2.9. Catalase (CAT) Technique
This enzymatic examination was carried out dependent on a prior detailed strategy with slight alteration [20]. CAT has two properties: (1) decomposition of hydrogen peroxide to give water and oxygen and (2) oxidation of hydrogen donors such as methanol, formic acid, ethanol, phenol, etc. In this strategy, the supernatant part (0.1 ml) was added to the cuvette containing 1.9 ml PBS (pH 7.0). The reaction was initiated by the addition of 1 ml of newly prepared 30 mm hydrogen peroxide. The rate of decomposition of hydrogen peroxide was estimated by a spectrophotometer at 240 nm. The activity of the CAT catalyst was communicated as unit / mg protein.
Calculation: Absorbance / minute’s × volume of assay / 0.081 of the volume of conjugate enzyme × protein
2.10. Lipid Peroxidation (LPO) Malondialdehyde (MDA) Technique
LPO assay was carried out by the earlier reported technique of Zúñiga-Muñoz et al. [21] with slight modification. The main function of LPO was to deliver peroxy radicals and singlet oxygen [22]. The final result of LPO was that MDA can be effortlessly estimated in bacterial culture and in this way fills in as a significant biomarker for LPO oxidative pressure [23,24]. The absorbance of the sample was taken utilizing an UV–Vis (ultraviolet–visible) spectrophotometer at 532 nm.
2.11. Protein Leakage Test
Protein leakage demonstrates the overall level of supramolecule, i.e., protein in a solution system and was carried out based on earlier reported methods with little modification [25]. This methodology consists of what quantity of protein concentration lies within the reactivity of the amide nitrogen with the copper ions below basic condition resulting in a reduction of the Folin–Ciocalteu phosphomolybdic phosphotungstic acid to hetero molybdenum blue by copper-catalyzed oxidation of aromatic acids.
2.12. Reduced Glutathione (GSH) Technique
GSH technique, the nonenzymatic method, was dictated by the previous revealed strategy with slight adjustment [26]. Microbial cells were incubated at the necessary temperature with or without tests to be read for 12 hours. Cells were centrifuged and pelleted out at 10,000 rpm for 5 minutes, washed with PBS, and lysed. The GSH levels of free supernatant were resolved dependent on the decrease in 5, 5?-dithiobis-(2-nitrobenzoic acid). 5, 5-dithiobis (2-nitrobenzoic acid) [Elman’s reagent, 5, 5?-dithio-bis-(2-nitrobenzoic acid), Sigma-Aldrich] was added to the mixtures to yield a yellow product. All samples were arranged and dissected in triplicate. The absorbance was taken at 412 nm utilizing a spectrophotometer.
2.13. Cell Line Study (MG-63 cell)
Cell line measure is a decent device in neoplastic exploration. The objective of this examination was to show the MTT measure in MG-63 cell lines. The MTT (3-(4, 5-dimethylthiazole-2-yl)-2, 5-diphenyl tetrazolium bromide) substance was diminished by mitochondrial dehydrogenases in living cells to a blue magenta-colored formazan precipitate. The cytotoxic compounds will harm and destroy cells prompting a decline in the MTT to formazan [27]. In the MTT assay, the direct connection between metabolically dynamic cells and the shading made is built up, thus allowing an exact evaluation of changes inside the pace of cell passing or multiplication [28]. During this test, cells were seeded into 96-well plates (Greiner, Frickenhausen, Germany) trailed by incubation beneath 5% CO2 at 37°C for 6 hours. Evaluation of formazan was finished utilizing a spectrophotometer at 540 nm. A high purple shaded force indicates higher cell feasibility, while the abatement in purple shaded power means the decreased cell go and hence cytotoxicity of the given substance (Fig. 1).
2.14. Statistical Analysis
Statistical analyses and graphical representations of data were carried out with Statistical Package for the Social Sciences software where appropriate, statistical analyses used analysis of variance with Tukey’s post-hoc test for various correlations. Statistical significance was resolved as p ≤ 0.05. Data are presented in bar graphs as mean ± SD.
3.0. RESULT AND DISCUSSION
3.1. Synthesis and Characterization of Complexes
Cu (II) complexes of Q (ligand) with N ^ N ligands as co-ligands have been integrated with acceptable yields. The complexes were obtained by reacting Q, copper acetate, and N ^ N ligands in solvent-free conditions at room temperature by the triturating method. Brown solid complexes 1 and 2 were obtained after triturating and were characterized by UV–Vis and FTIR spectroscopy. Complexes were synthesized in very good yield, i.e., >97%. Solid-state synthesis is also known as green synthesis because there is no need for any additives for the completion of the reaction. This synthesis is more beneficial when compared to the current conventional organic reaction as it reacts faster, with fewer steps required for completion of the reaction, is cost-effective, and has a green impact on the environment [29].
3.2. Solubility Test
The synthesized complexes, i.e., complex 1 and complex 2, were soluble only in DMSO and dimethylformamide (DMF).
 | Figure 1. Flow diagram representing the systematic conversion of MTT to formazan. [Click here to view] |
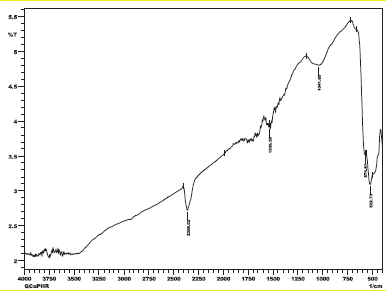
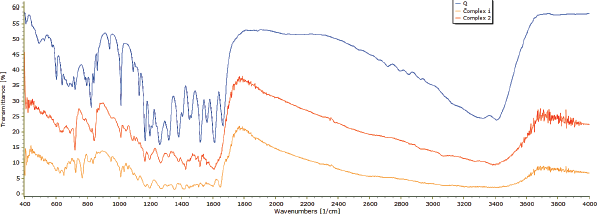 | Figure 2. FTIR spectra of ligands and their complexes. [Click here to view] |
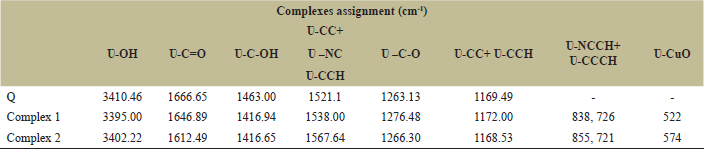 | Table 1. FTIR spectral (cm-1) assignment ligand and their complexes. [Click here to view] |
3.3. Infrared Analysis
The tasks of the wavenumbers were chosen and handpicked from the FTIR spectra (Fig. 2) of Q and its metallic element, i.e., zinc bipyridal and phenanthroline, and are tabulated in Table 1. FTIR analysis of the residue obtained after heating of complex 1 and 2 above 800°C showed bands at 522 and 574 cm−1 (Figs. S1 and S2) [30]. These bands are characteristics of left copper oxide (CuO) after heating indicate the presence of Cu in reported complexes (1 and 2).
3.4. Photochemistry
The UV–visible spectra of Q, complex 1, and complex 2 were determined in the DMSO solution (Fig. 3) and the spectra of complex 1 and 2 relevant to the spectra of ligand, i.e., Q. The absorption band of ligand (379 nm) shifted toward a longer wavelength (bathochromic shift), i.e., at 450 and 452 nm, respectively, in complex 1 and 2. This band-moving is expected to π–π* progress of Q and phenanthroline ligands concerning Q cinnamoyl band giving the development of metal–oxygen bond in ring C and cooperation of 3-OH group in the chelation [31].
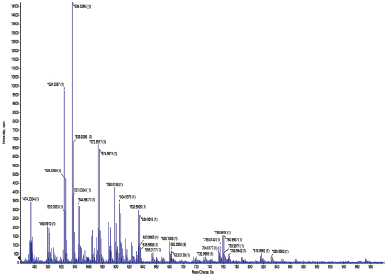
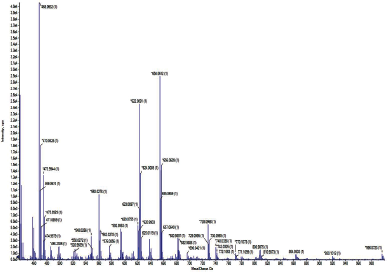
3.5. High-Resolution Mass Spectroscopy (HRMS) Study
HRMS studies of the complexes were carried out to find out the molecular weight of the compound. HRMS spectra of complex 1 were taken in the positive mode and the peak at m/z (Calc.) 598.024 and (Exp.) 598.0138 [(Q-H) + Cu (II) (Bpy) (AcO) (H2O)] corresponding to the formation of QCuBpyAcOH2O with a stoichiometry of 1:1:1 (Fig. S3). The HRMS spectra of complex 2 were also taken in positive mode and the peak at m/z (Calc.) 622.044 and (Exp.) 622.0091 [(Q-H) + Cu (II) (Phen) (AcO) (H2O)] corresponds to the formation of QCuPhenAcOH2O with a stoichiometry of 1:1:1 (Fig. S4).
3.6. Antioxidant Study
It is seen that Q (IC50 = 38.1427 μg/ml), complex 1 (IC50 = 168.97 μg/ml), and complex 2 (IC50 = 125.932 μg/ml) have significant free radical scavenging activities at concentrations of 20, 50, 100–500 μg/ml, respectively. From that, it was concluded that complex 2 has significant antioxidant activity when compared to complex 1 and Q (Fig. 4, Table 2).
3.7 Minimum Inhibitory Concentration (MIC) Determination of Ligand and their Complexes
The minimum inhibitory concentration activity of the ligand and its complexes concentrated on the development of tried types of microorganisms. It was seen that Cu (II) complexes have a higher growth inhibitory impact than free ligands. With regard to E. coli, Cu (II) complex 2 (6.35 μg/ml) was observed showing the most potent activity when compared to the complex 1 (25.83 μg/ml) and Q (31.25 μg/ml). The same trend was observed in the case of S. aureus also with slightly higher MIC values in comparison to E. coli in the order of complex 2 (13.74 μg/ml), complex 1 (50.37 μg/ml), and Q (62.57 μg/ml). Finally, it was observed that the MIC value of complex 2 is most significant in both E. coli and S. aureus when compared to the free ligand and complex 1 (Table 3). Prior examinations have also reported copper derivatives as an effective antibacterial agent in different Gram-negative and Gram-positive microbes and the growth inhibition was in a dose-dependent manner [32].
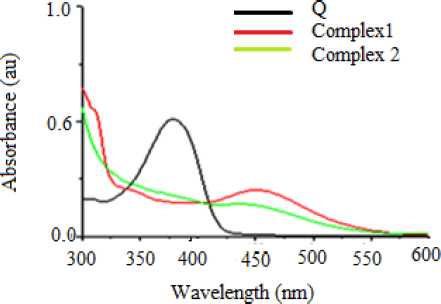 | Figure 3. Absorption spectra of ligands and their complexes in 10 μm DMSO solution. [Click here to view] |
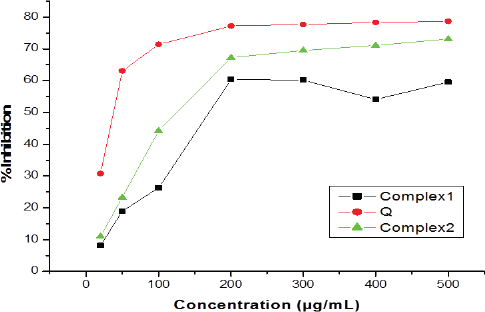 | Figure 4. Comparison of antioxidant activity ligands and their complexes. [Click here to view] |
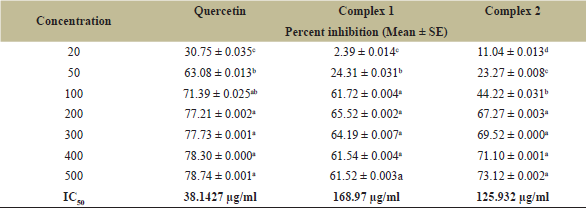 | Table 2. Antioxidant activity of the ligand and their complexes. [Click here to view] |
3.8. Superoxide Dismutase (SOD) and Catalase (CAT)
It was seen that Cu (II) complex 1 and complex 2-treated microorganisms showed essentially lower SOD levels. SOD levels in the case of E. coli was found to be 12.52 units/mg (complex 2) and 26.82 units/mg (complex 1) when compared to the normal control (41.23 unit/mg) and Q (32.81 unit /mg). The same trend was observed in the case of S. aureus also as 18.64 and 23.78 unit/mg in complex 2 and complex 1, respectively, when compared to control (31.75 unit/mg) and Q (25.34 unit/mg). The CAT activity level was also reduced significantly in the complexes and Q-treated bacterial cells when compared to normal control. Complex 1 and 2 showing similar activity patterns in E. coli (27.23 and 11.54 unit/mg) were found less comparable to Q (31.21 unit/mg) and normal control (43.46 unit/mg). A similar CAT reduction effect was observed in the case of S. aureus also upon treatment with complex 1 (23.61 unit/mg) and 2 (21.60 unit/mg) when compared to the Q (28.27 unit/mg). The data are shown in Figure 5A and B. Along these lines, the observed decrease in antioxidant activity levels in complex 1 and complex 2-treated E. coli and S. aureus cells might be because of the interruption of the electron transport gatherings in the plasma layer. Cell membrane disruption causes downregulation of antioxidant molecules, like GSH, just a denaturation of enzymes like SOD and CAT, which hinders the electron transport pathway and prompts cell demise [33].
3.9. Lipid Peroxidation (LPO)
LPO or malondialdehyde (MDA) examination assumes a significant role in oxidative stress by losing peroxy radicals and singlet oxygen. It loses chemical malondialdehyde that is responsible for oxidative stress in the treated bacterial culture. Therefore, the activity of complex 1 and complex 2 treatments on the MDA level of E. coli and S. aureus was measured. Complex 2 (487.37 nm/ml)-treated E. coli showed highest level of MDA when compared to complex 1 (413.46 nm/ml), Q (328.38 nm/ml), and normal control (241.68 nm/ml). A similar trend was observed in S. aureus-treated cells also in the order of complex 2 (273.36 nm/ml), complex 1 (258.17 nm/ml), Q (211.67 nm/ml), and normal control (138.32 nm/ml) (Fig. 6). These outcomes propose that the inhibition of bacterial growth was because of complex 1 and complex 2-mediated upregulation of malondialdehyde level in the bacterial cells. Past examinations firmly recommend that oxidative pressure assumes an urgent job in mediating toxicity in bacterial cells and our outcomes demonstrate that copper derivatives produced higher levels of reactive oxygen species generation compared to control [34].
 | Table 3. MIC data ligands and their complexes. [Click here to view] |
3.10. Glutathione (GSH) and Protein Leakage
To examine the impacts of complex 1 and complex 2 on metabolic activity, the degrees of intracellular macromolecules, such as proteins, were analyzed. The impact of complex 1 and complex 2 on protein leakage by treating E. coli and S. aureus cells at their MIC (15.62, 7.8 μg/ml respectively) was investigated for 12 hours. The measure of protein delivered in the suspension of the treated cells was evaluated using the Lowry method [25]. Protein spillage was seen as higher in complex 1 and complex 2-treated cells contrasted with untreated cells (Fig. 7D). In any case, complex 1-treated E. coli cells demonstrated essentially higher protein spillage (296.72 μg/ml) in contrast to S. aureus cells (286.01 μg/ml), while in E. coli complex 2-treated cells indicated fundamentally higher protein spillage (387.72 μg/ml) in contrast to S. aureus cells (301.21 μg/ml). It suggests that the Gram-positive S. aureus had lower antibacterial affectability than that of the Gram-negative E. coli cells. In this way, our outcomes are steady with those of past examinations for intracellular leakage of macromolecules in treatment with antibacterial. The capacity of glutathione plays an important role in maintaining an intracellular reducing environment and combating oxidative stress in a variety of organisms such as Gram-positive and Gram-negative bacteria [35]. GSH, a thiol-containing tripeptide, prevalently exists at elevated levels in decreased forms and functions by scavenging reactive oxygen species to keep up the balance in the cellular redox condition and ensure cells against oxidative stress [36]. It was observed a decrease in GSH levels in complex 1 and complex 2-treated E. coli was 37% and 77.06% and in S. aureus was 19.66% and 27.37%, respectively, when contrasted with untreated cells (Fig. 7E). These outcomes give proof that GSH exhaustion in complex 1 and complex 2-treated cells was liable for excessive ROS generation, which overpowered the antioxidant defense system, prompting oxidative stress and loss of cell viability. Therefore, the abovementioned results suggest that complex 1 and complex 2 apply negative consequences on antioxidant molecules present in normal bacterial cells.
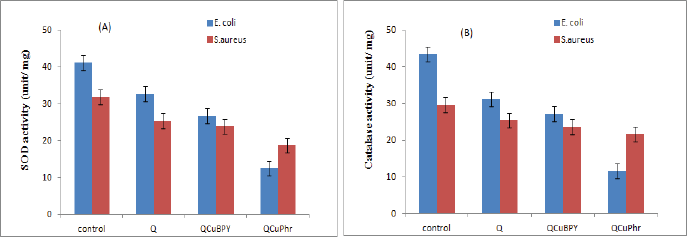 | Figure 5. Effect of complex 1 and complex 2 on SOD and CAT activities. (A) E. coli and S. aureus cells treated with individual MIC of complex 1 and complex 2 for 12 hours. SOD (A) and CAT activities (B) results are communicated as mean ± SD of three separate experiments, with three repeats per experiment. Statistically significant differences between treatment and control groups were resolved utilizing Student’s t-test (p < 0.05). [Click here to view] |
3.11. Microbial Cell Proliferation Assay
The dose-dependent microbial cell proliferation activity of complex 1 and complex 2 was determined by selecting E. coli and S. aureus (Fig. 8A and B). The studies show the inhibitory effect at various concentrations ranging from 0.2 to 2 μg/ml. Treatment with Cu (II) complex 1 and Cu (II) complex 2 diminished cell feasibility in both bacterial strains, in contrast to Q. Complete growth inhibition was observed at 2 μg/ml in complex 2-treated E. coli, whereas S. aureus did not show complete inhibition. The results obtained were also observed showing a dose-dependent effect in both microbes but lacked complete inhibition in S. aureus. Furthermore, these outcomes are predictable with the obtained MIC values for each bacterial strain. Therefore, complex 1 and complex 2 delivered by means of Q-interceded synthesis displayed reduced cell viability assay. The images captured under scanning confocal microscopy indicated dead microbes in red color as shown in Figure 9, and green color indicates the live cells. It is seen that the quantity of dead cells is more in complex 2-treated cells when compared to complex 1 and Q (Fig. 10A–F) [37].
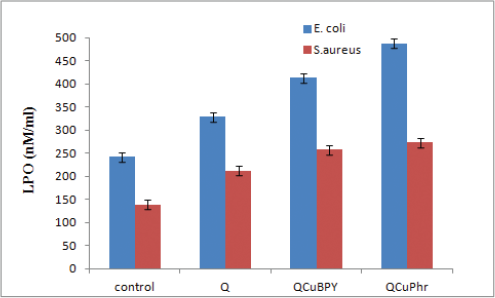 | Figure 6. Effect of complex 1 and complex 2 on MDA: E. coli and S. aureus cells treated with respective MIC of complex 1 and complex 2 for 12 hours. Results are communicated as means ± SD of three separate experiments, with three replicates per experiment. Statistically significant differences between treatment and control groups were resolved utilizing Student’s t-test (p < 0.05). [Click here to view] |
 | Figure 7. Effect of complex 1 and complex 2 on leakage of protein and GSH activity (D) for protein leakage analysis. E. coli and S. aureus cells were treated with the respective MIC of complex 1 and complex 2 for 12 hours, and protein levels were measured using the Lowry method; and (E) for GSH analysis, (A) E. coli and S. aureus cells treated with respective MIC of complex 1 and complex 2 for 12 hours. GSH levels were estimated enzymatically in the free supernatant dependent on the decrease of 5,50-dithiobis-(2-nitrobenzoic acid) by the GSH reductase system. [Click here to view] |
3.12. MG-63 Cell Cytotoxicity Assay
MG-63 cells were cultured on Cu (II) complex 1 and complex 2 for 3, 5, and 7 days. A prominent increment in cell expansion was seen in all samples with increasing culture time, which could be viewed as the great cytocompatibility of the materials. At day 1, for 100 ppm concentration there were slight contrasts in the OD values among the various gatherings of tests, yet on day 3 and day 5, the OD esteem for the unpredictable complex 1 and complex 2 was essentially higher. As the concentration increases 500 ppm, the OD value increases fast and this showed drugs will bind more tightly to the cells. The MTT results demonstrated that the multiplication of cells on complex 1 is higher than complex 2 (Fig. 10). The cytotoxicity results supporting the observation found in microbial cells. The toxicity results of complex 1 and 2 found comparable to the Q compound on day 7 [38].
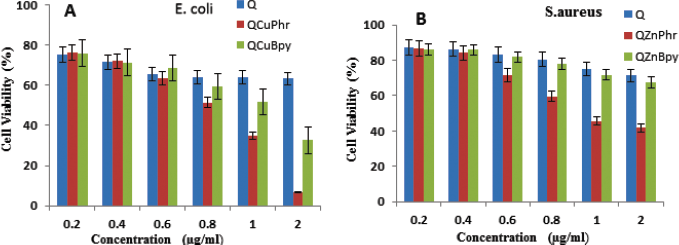 | Figure 8. Effect of complex 1, complex 2, and quercetin on cell viability. (A) E. coli and (B) S. aureus cells incubated with various concentrations of complex 1, complex 2, and quercetin. Bacterial survival determined at 24 hours supported a CFU count assay. The experiment was carried out with various controls. Results are expressed as mean ± SD of three separate experiments, with three replicates per experiment. Statistically significant differences between treatment and control groups were resolved utilizing Student’s t-test (p < 0.05). [Click here to view] |
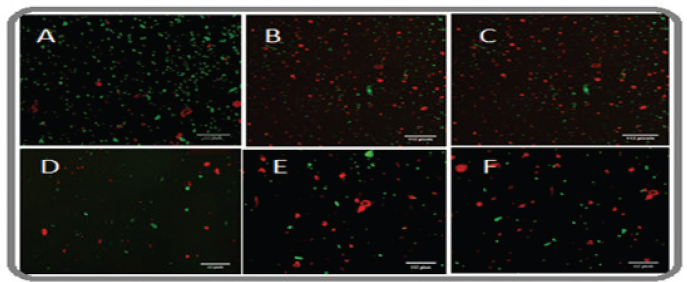 | Figure 9. Florescent image of complex 1 and complex 2 on E. coli cell viability (A) quercetin (B) complex 1, and (C) complex 2 and S. aureus (D) quercetin, (E) complex 1, and (F) complex 2. [Click here to view] |
 | Figure 10. MTT examination for quercetin copper Bpy (complex 1) and quercetin copper Phen (complex 2) was carried out using MG-63 cells. The cells were treated with different concentrations (100 and 500 ppm) of complex 1 and complex 2 and the metabolic activity was measured. At 100 ppm concentration, cell metabolic action was less, and as the fixation increased, for example, 500 ppm, fixation cell metabolic movement also increased. [Click here to view] |
4. CONCLUSION
The newly synthesized Cu (II) acetate complexes with two naturally related chelating ligands (BPY = 2, 2’-bipyridine, Phen = 1, 10-phenanthroline) and Q were described by spectroscopic and analytical methods. FTIR and UV spectroscopy show that Q coordinates through ring C, i.e., carbonyl group and 5-OH hydroxyl group. HRMS studies indicate the complexation sites of the molecules along with its composition and stoichiometry based upon the mass of complexes. Both the complexes coordinate through ring C, i.e., carbonyl group and 5-OH hydroxyl group, with a stoichiometry of metal: flavonoid: N–N dentate ligands at 1:1:1. Both the complexes, i.e., complex 1 and complex 2, are only soluble in DMSO and DMF solvents. The complexes were found to be more significantly antibacterial when compared to Q alone; this would be due to the increase in bioavailability as the earlier report suggests [16]. Both complex 1 and complex 2 actuated losses of cell viability would be intervened by means of system, such as the impairment of metabolic activity, spillage of intracellular proteins, and expanded oxidative stress [35]. Free radical scavenging activity shows that complex 2 has more antioxidant potential than complex 1. MIC data indicate that complex 2 is more potent than complex 1 and Q against E. coli and S. aureus bacteria. The fluorescence image of microbes also supports the finding. It likewise proposes that mind boggling complex 1 and complex 2 applies an antibacterial effect in a dose-dependent manner and the activity is due to the influence of antioxidant enzymes, protein leakage, and ROS production. An earlier report also suggests this phenomenon supporting our findings [37]. The complexes formed are found to be more potent in antibacterial activity compared to Q. Cytotoxicity in mammalian osteosarcoma cell lines (MG-63) also confirms that the complexes are safe up to 500 ppm. The complexes can be further studied using several other microbes and the activity can be compared with some standard marketed antibiotics.
5. ABBREVIATIONS
Q, Quercetin; DMF, Dimethyl formamide; DPPH, 1, 1-Diphenyl-2-picrylhydrazyl; FTIR, Fourier Transformation Infra-Red Spectroscopy; DFT, Density Functional Theory; Cu2+, Copper ions; CuO, Copper oxide; Ac, Acetate ions; DMSO, Dimethyl sulfoxide; HRMS, High-Resolution Mass Spectroscopy.
6. ACKNOWLEDGMENT
The authors are appreciative of Dr. S. K. Mishra, Department of Pharmaceutics, IIT-BHU, for his moral support and encouragement.
7. DISCLOSURE STATEMENT
The authors pronounce that there is no conflict of interest with respect to the publication of this paper.
8. FUNDING
This research did not get any specific grant from funding agencies in the public, commercial, or not-for-profit sectors.
9. DATA AVAILABILITY STATEMENT
The data that support the findings of this study are available on request from the corresponding author (Tanu Srivastava). The data are not publicly available due to restrictions, e.g., they contain information that could compromise the privacy of the research participants.
REFERENCES
1. Middleton E Jr, Kandaswami C, Theoharides TC. The effects of plant flavonoids on mammalian cells: implications for inflammation, heart disease, and cancer. Pharmacol Rev 2000;52(4):673–751.
2. Nijveldt RJ, van Nood E, van Hoorn DE, Boelens PG, van Norren K, van Leeuwen PA. Flavonoids: a review of probable mechanisms of action and potential applications. Am J Clin Nutr 2001;74:418–25. CrossRef
3. Heim KE, Tagliaferro AR, Bobilya DJ. Flavonoid antioxidants: chemistry, metabolism and structure-activity relationships. J Nutr Biochem 2002;1:572. CrossRef
4. Liu Y, Guo M. Studies on transition metal-quercetin complexes using electrospray ionization tandem mass spectrometry. Molecules 2015;20:8583–94. CrossRef
5. Yang YC, Lin HY, Su KY, Chen CH, Yu YL, Lin CC, et al. Rutin, a flavonoid that is the main component of Saussurea involucrata, attenuates the senescence effect in the D-galactose aging mouse model. Evid Based Complement Alternat Med 2012;2012:1–10. CrossRef
6. Carvalho JC, Sertie JA, Barbosa MV, Patrício KC, Caputo LR, Sarti SJ, et al. Anti-inflammatory activity of the crude extract from the fruits of Pterodon emarginatus Vog. J Ethnopharmacol 1999;64(2):127–33. CrossRef
7. Yu L, Zhou K, Parry JW. Inhibitory effects of wheat bran extracts on human LDL oxidation and free radicals. LWT Swiss Soc Food Sci Technol 2005;38(5):463–70. CrossRef
8. Willis MS, Monaghan SA, Miller ML, McKenna RW, Perkins WD, Levinson BS, et al. Zinc-induced copper deficiency: a report of three cases initially recognized on bone marrow examination. Am J Clin Pathol 2005;123:125–31. CrossRef
9. Tandon PK, Singh SB. Catalytic applications of copper species in organic transformations: a review. J Catal Catal 2014;1(2):21–34.
10. Panhwar QK, Memon S, Bhanger MI. Synthesis, characterization, spectroscopic, and antioxidation studies of U(II)-morin complex. J Mol Struct 2010;967:47–53. CrossRef
11. Punniyamurthy T, Rout L. Recent advances in copper-catalyzed oxidation of organic compounds. Coord Chem Rev 2008;252:134–54. CrossRef
12. Guidoni L, Spiegel K, Zumstein M, Röthlisberger U. Green oxidation catalysts: computational design of high-efficiency models of galactose oxidase. Angew Chem Int Ed Engl 2004;116:3348–51. CrossRef
13. Gao J, Xu XY, Ma WX, Wang MY, Song HB, Yang XJ, et al. Synthesis, crystal structures and toxicity of bicadmium(II) complexes with macrocyclic, hexaaza-bearing, hydroxyethyl pendants. J Coord Chem 2004;57:1553. CrossRef
14. Aziza SRA, Hossain MA. Study on total phenolic and antioxidant potential of leaves crude extracts of Annona squamosal traditionally used for the treatment of cancerous tumors. Asian Pac J Trop Dis 2015;5:142–4. CrossRef
15. de Araújo RF Júnior, de Araújo AA, Pessoa JB, Freire Neto FP, da Silva GR, Leitão Oliveira AL et. Al. Anti-inflammatory, analgesic, and anti-tumor properties of gold nanoparticles of malignant cells. Pharmacol Rep 2017;69:119–29. CrossRef
16. Granato M, Rizzello C, Gilardini Montani MS, Cuomo L, Vitillo M, Santarelli R, et. al. Quercetin induces apoptosis and autophagy in primary effusion lymphoma cells by inhibiting PI3K/AKT/mTOR and STAT3 signaling pathways. J Nutr Biochem 2017;41:124–36. CrossRef
17. León IE, Etcheverry SB, Baran EJ. Cytotoxicity action of an oxidovanadium (IV)-DPPZcomplex on MG-63 human osteosarcoma cell line. Biotechnol Indian J 2015;11(12):465–8.
18. Satué M, Arriero Mdel M, Monjo M, Ramis JM. Quercitrin and taxifolin stimulate osteoblast differentiation in MC3T3-E1 cells and inhibit osteoclastogenesis in RAW 264.7 cells. Biochem Pharmacol 2013;86:1476–86. CrossRef
19. Beauchamp C, Fridovich I. Superoxide dismutase: improved assay and an assay applicable to acrylamide gel. Anal Biochem 1976;44:276–87. CrossRef
20. Sinha AK. Colorimetric assay of catalase. Anal Biochem 1972;47:389–94. CrossRef
21. Zúñiga-Muñoz AM, Pérez-Torres I, Guarner-Lans V, Núñez-Garrido E, Velázquez ER, Huesca-Gómez C, et al. Glutathione system participation in thoracic aneurysms from patients with Marfan syndrome. Vasa 2017;46:177–86; doi:10.1024/0301-1526/a000609 CrossRef
22. Rahal A, Kumar A, Singh V, Yadav B, Tiwari R, Chakraborty S, et al. Oxidative stress, prooxidants, and antioxidants: the interplay. BioMed Res Int 2014;2014:761264. CrossRef
23. Esterbauer H, Cheeseman KH. Determination of aldehydes lipid peroxidation products: malonaldehyde and 4-hydroxynonenal. Methods Enzymol 1990;186:407–21. CrossRef
24. Guru Nathan S, Woong Han J, Kim E, Kwon DN, Park JK, Kim JH. Enhanced green fluorescent protein-mediated synthesis of biocompatible graphene. J Nanobiotechnol 2014;12:41. CrossRef
25. Lowry OH, Rosebrough NJ, Farr AL, Randall RJ. Protein measurement with the Folin phenol reagent. J Biol Chem 1951;193:265–75. CrossRef
26. Beutler E, Duron O, Kelly B. Improved method for determination of blood glutathione. J Lab Clin Med 1963;61:88.
27. Mosmann T. Rapid colorimetric assay for cellular growth and survival: application to proliferation and cytotoxicity assays. J Immunol Methods 1983;65:55–63. CrossRef
28. van Meerloo J, Kaspers GJ, Cloos J. Cell sensitivity assays: the MTT assay. Methods Mol Biol 2011;731:237–45. CrossRef
29. Chattopadhyay G, Ray PS. Facile method for the conversion of semicarbazone/thiosemicarbazones into azines (under microwave irradiation) and oxadiazoles (by grinding). Synth Commun 2011;41:2607. CrossRef
30. Prakash V, Diwan RK, Niyogi UK. Characterization of synthesized copper oxide nanopowders and their use in nanofluids for enhancement of thermal conductivity. Indian J Pure Appl Phys 2015;53:753–58.
31. Andelescu AA, Cretu C, Sasca V, Marinescu S, Cseh L, Costisor O, et al. New heteroleptic Zn (II) and Cu (II) complexes with quercetin and N^N ligands. Polyhedron 2018;147:120–5; https://doi.org/10.1016/j.poly.2018.03.016 CrossRef
32. Chandraleka S, Ramya K, Chandramohan G, Dhanasekaran D, Priyadharshini A, Panneerselvam A. Antimicrobial mechanism of copper (II) 1, 10-phenanthroline, and 2, 20-bipyridyl complex on bacterial and fungal pathogens. J Saudi Chem Soc 2014;18:953–62. CrossRef
33. Rizzello L, Pompa PP. Nano silver-based antibacterial drugs and devices: mechanisms, methodological drawbacks, and guidelines. Chem Soc Rev 2014;43:1501–18. CrossRef
34. Chatterjee AK, Chakraborty R, Basu T. Mechanism of antibacterial activity of copper nanoparticles. Nanotechnology 2014;25:135101; doi:10.1088/0957-4484/25/13/135101 CrossRef
35. Yuan YG, Peng QL, Gurunathan S. Effects of silver nanoparticles on multiple drug-resistant strains of Staphylococcus aureus and Pseudomonas aeruginosa from mastitis-infected goats: an alternative approach for antimicrobial therapy. Int J Mol Sci 2017;18:569; doi:10.3390/ijms18030569. CrossRef
36. Masip L, Veeravalli K, Georgiou G. The many faces of glutathione in bacteria. Antioxid Redox Signal 2006;8:753–62. CrossRef
37. Warburg O. The metabolism of tumors. Constable and Co. Ltd., London, 1930.
38. Vimalraj S, Rajalakshmi S, Raj Preeth D, Vinoth Kumar S, Deepak T, Gopinath V, et al. Mixed-ligand copper(II) complex of quercetin regulates osteogenesis and angiogenesis. Mater Sci Eng C Mater Biol Appl 2018;83:187–94; doi:10.1016/j.msec.2017.09.005 CrossRef
SUPPLEMENTARY FIGURES
 | Fig. S1. FT-IR spectrum of Complex 1 residue (CuO). [Click here to view] |
 | Fig. S2. FT-IR spectrum of Complex 2 residue (CuO). [Click here to view] |
 | Fig. S3. HRMS spectra of Complex 1. [Click here to view] |
 | Fig. S4. HRMS spectra of Complex 2. [Click here to view] |