
1. INTRODUCTION
India is a major agroeconomic country. The majority of the area is used for farming, and multiple crops are grown in various regions. Rice accounts for the majority of the yearly crop output (137.8 Mt), followed by wheat (110.5 Mt) (Food and Agriculture Organization). In 2021, the amount of rice produced worldwide was 787 Mt; India was second, with 137.8 Mt [1]. As a result, large amounts of rice straw are produced, accounting for 23% of the total agricultural crop residue in most Indian states. Farmers plant three crops annually, and harvesting techniques are shifting from manual to mechanical, leaving straw on the fields. To clear the field for the following crop farmers, the illegal practice of burning straw is used, which has detrimental impacts on the environment and results in the loss of nutrients such as N, P, K, and S [2]. However, due to a decrease in the availability of water and continuous cultivation, the fertility of the soil and the soil organic matter content have started to decrease, reducing the potential yield [3,4]. Mismanagement of crop residues leads to ecological issues such as straw burning, air pollution, and human health [5,6]. To reduce the negative impacts of burning and exploit the enormous energy potential of straw, the utilization of straw for multiple purposes should be promoted [7,8]. In the case of the Punjab region, India, over 50 Mt/year of agricultural residue is produced, of which approximately 20 Mt/year is burned [9]. Every year, in north part of India, during the months of October and November, a sudden rise in the fog layer of pollutants as well as particulate matter in the environment poses serious environmental and human health hazards. The major factor associated with this increased pollutant is somewhere related to crop residue burning which results in major problems such as loss of sight, irreversible climate change, and a disturbance of natural ecology and societies. We have created an India-Japan joint research initiative called Aakash (an interdisciplinary project on clean air, public health, and sustainable agriculture). The focus of this group is on finding a probable solution to the major challenge of rice residue burning in Punjab, India. In the past, several management strategies have been proposed and implemented to address this issue. However, to date, no sustainable management practice is available to completely prevent fire incidents and reduce air pollution. The collaborative project sought to investigate the possibilities of converting the rice residue into biochar and using it as a soil conditioner and nutrient reservoir for succeeding crops. The application of biochar is in line with current green development principles because it serves important function in maintaining ecosystem equilibrium, lowering soil contamination, and enhancing the sustainable development of the agricultural ecosystem. [10]. Biochar is a porous, carbonaceous material produced by the thermal decomposition of biomass under controlled oxygen-limited environments, for example, plant residues and agricultural residues. Pyrolysis is the process of heating feedstock to high temperatures in the absence or close to the absence of oxygen, hence preventing full combustion. The end product is a stable type of charcoal with a well-structured pore material known as biochar [11]. It has received much interest in the past decade due to its multiple advantages in several disciplines, including the health of the soil, food production, treatment of wastewater, and climate change [12]. The application of biochar enhances soil quality and sequestration of carbon while reducing greenhouse gas emissions (CO2, N2O, and CH4). When biochar is added to the soil, it influences physiochemical soil parameters such as C, pH, CEC, porosity, surface area, water holding capacity, bulk density, nutrient use efficiency, available P, and total N, among other soil amendments [13]. In addition, it reduces soil hardening and improves porosity, which is advantageous to soil microbes and nutrient cycling [14]. Biochar can also assist in the recovery of damaged and polluted soils through long-lasting adsorption of toxic metals as well as other soil pollutants [15]. However, the ultimate effect of biochar on the previously mentioned parameters significantly depends on the feedstock source, temperature, pyrolysis, biochar dimensions, and soil texture [16]. A significant research gap exists regarding the effects of biochar on physiological aspects and grain quality of a crop. It is well documented that biochar increases drought tolerance and quality traits by improving water use efficiency and photosynthesis rate, but the ideal application dose is uncertain. In addition, the residual impacts of biochar on wheat physiology and grain quality over several seasons are not well known. Studying these elements is essential to promote sustainable agriculture practices that optimize the advantages of biochar in wheat production. We hypothesized that the use of biochar would improve plant physiology and their impact on grain metrics. This research is critical for ensuring a stable and resilient future in wheat production for sustainable agriculture and food security. The use of biochar also provides insight into which method is more effective for improving grain quality.
2. MATERIALS AND METHODS
2.1. Experimental Site and Design
An experiment involving the wheat (Triticum aestivum L.) variety PBW 824 was carried out at Lovely Professional University’s agricultural research farm in Jalandhar, Punjab, from 2023 to 2024. The coordinates for the location are latitude 31°14’30.5’’N and longitude 75°41’52.1” E. A total of 9 treatments were executed through a randomized complete block design, with three replications. These included T1 (absolute control), T2 (100% RDF), T3 (100% NP), T4 (NP + rice husk biochar 5 t/ha), T5 (NP + rice husk biochar 10 t/ha), T6 (NP + rice husk biochar 15 t/ha), T7 (NP + rice straw biochar 5 t/ha), T8 (NP + rice straw biochar 10 t/ha), and T9 (NP + rice straw biochar 15 t/ha). The plot size was 5 × 5 m (25 m²), with a row spacing of 22.5 cm. The experiment was conducted between the year 2022 and 2024.
2.2. Biochar Preparation
The biochar was produced from rice straw before it was properly dried. Biochar was produced from the carbonization of rice straw under an open fire in a stainless-steel tub with a height of 48 cm and a diameter of 142 cm. The open fire method used in this study is an autothermal process that partially burns the feedstock to heat the remaining material, converting it into char. The rice straw feedstock was placed inside the tub of the open burn and ignited. Carbonization of the feedstocks occurs beneath the flames, where oxygen is absent, because the flames consume all of it, thus creating a pyrolysis zone. The lack of oxygen prevents combustion, and thus, the biomass smoulders but does not release flames or smoke. Instead, much of it is transformed into high-carbon charcoal, oil, and gas. The pyrolysis of the rice straw was performed at 400–600°C, and the temperature was measured through a heat sensor thermometer. The feedstocks were added continuously until the tube was filled and then quenched with water. The yield of biochar, based on the dry weight of the initial biomass, ranged from 45% to 50%. The characteristics of biochar were determined using EDX mapping, as illustrated in Table 1.
Table 1: Represents the biochar properties analyzed using EDX mapping (average value).
| Properties | Rice Straw Biochar | Rice Husk Biochar | ||||
|---|---|---|---|---|---|---|
| S1 | S2 | S3 | S1 | S2 | S3 | |
| pH | 10.1±0.21 | 9.8±0.19 | 9.5±0.26 | 10.5±0.16 | 10.2±0.26 | 9.7±0.39 |
| EC (d/Sm) | 0.14±0.01 | 0.12±0.03 | 0.10±0.05 | 0.16±0.03 | 0.13±0.05 | 0.11±0.01 |
| Carbon (%) | 51.67±0.15 | 45.64±0.13 | 39.5±0.09 | 35.79±0.13 | 74.60±0.22 | 64.8±3.4 |
| Nitrogen (%) | 0.32±0.01 | 0.22±0.03 | 0.17±0.01 | 0.83±0.06 | 1.39±0.12 | 1.24±0.09 |
| Phosphorus (%) | 0.55±0.07 | 0.17±0.05 | 0.08±0.02 | 1.73±0.10 | 0.23±0.08 | 0.18±0.03 |
| Potassium (%) | 6.80±0.51 | 0.43±0.23 | 0.37±0.04 | 2.12±0.32 | 0.79±0.28 | 0.57±0.17 |
| Calcium (%) | 0.52±0.46 | 1.98±0.48 | 2.25±0.09 | 5.12±0.68 | 0.97±0.46 | 0.84±0.21 |
| Magnesium (%) | 1.70±0.07 | 1.15±0.06 | 1.03±0.02 | 0.91±0.05 | 0.29±0.05 | 0.16±0.01 |
| Silica (%) | 13.16±0.23 | 15.85±0.28 | 11.2±0.01 | 17.89±0.30 | 0.43±0.08 | 0.41±0.01 |
S1: Fresh biochar, S2: One season old residual biochar, S3: Two seasons old residual biochar.
2.3. Plant Physiological Metrics
2.3.1. Chlorophyll index and content
The chlorophyll index in the leaves of wheat plants was recorded at different growth intervals, that is, 30, 60, 90, and 120 DAS using SPAD meter model 502. Similarly, in the same interval, total chlorophyll content (including Chlorophyll a and b) in the leaves was also estimated using the acetone extraction method [31] and then analyzed by spectrophotometer. Chlorophyll extraction involved grinding 100 mg of fresh plant leaf material from each treatment using 20 mL of 80% acetone. After centrifugation for 10 min at 5000 rpm, the supernatant was transferred to a volumetric flask, and the extraction was repeated until the residue became colorless. The absorbance of the extract was recorded at 645 and 663 nm in a spectrometer, and the chlorophyll content was determined by formula:
 |
Where, V= Final volume, W= Fresh weight, A= Absorbance at the given wavelength.
2.3.2. Relative water content (RWC)
For the calculation of RWC, the flag leaves were harvested and analyzed straight away to avoid water losses from evaporation. The samples were weighed immediately as fresh weight (FW), then sliced into 2 cm discs, and floated on distilled water for 4 h. The turgid leaf discs were then rapidly blotted to remove surface water and weighed to obtain turgid weight (TW). The leaf discs were dried in the oven at 60°C for 24 h and then dry weight (DW) was obtained. The RWC was calculated by the formula given by Barrs [17]:
RWC (%) = ([FWDW]/[TW-DW] * 100
2.3.3. Membrane stability index and membrane injury index (MII)
The membrane stability index (MSI) and MII were assessed by soaking 200 mg of fresh leaves in 10 mL of double distilled H2O in two sets. One pair was heated in a water bath at 40°C for 30 min before being tested for electrical conductivity (C1). The second set was heated in a water bath at 100°C for 10 min before conductivity (C2) testing. The calculation is performed through the following formula Premachandran [18]:
MSI %= 100 (1−C1/C2)
MII %= 100−(C1/C2)
2.4. Grain Quality Attributes
2.4.1. Grain proximate parameters
Proximate analysis of wheat grain was conducted using the Association of Official Agricultural Chemists methods (2000) to determine the contents of carbohydrates [19]. To estimate the total protein, first nitrogen content in the grains was assessed through the micro-Kjeldahl method, and the obtained nitrogen value was multiplied by 6.25 to calculate crude protein [32].
2.4.2. Wet and dry gluten content
The wet gluten content of flour was determined using the hand-washing method with a 2% NaCl solution, following (American Association of Community Colleges [AACC], 2000) Method 38-12.01 [20]. Three grams of wheat flour was mixed with distilled water (starting with 2 mL) to form a firm dough, which was allowed to rest at 25°C for 30 min before washing. The dough was gently kneaded in a stream of washing water over nylon cloth until all starch and soluble materials were removed. Washing continued until the water from the gluten mass produced no white cloud in a clean beaker. The gluten was then soaked in washing water for about an hour, pressed to remove excess water, rolled into a ball, and placed in a pre-weighed dish to record the net mass as wet gluten. Dry gluten was determined by drying the wet gluten at 100 degrees Celsius for 24 h as described in (AACC, 2000) method 38-12.01 [20].
2.5. Statistical Analysis
Statistical computation R Studio software (version 4.2.2) was employed to compute the analysis of the data used in this research. Analysis of variance (ANOVA) was done at p<0.05 significance level to indicate significant differences among group means. ANOVA was followed by a post hoc test using the Duncan Multiple Rage Test to determine specific differences between groups. A clear and efficient evaluation of the outcomes was made possible by the graphical visualizations of the data created using Origin Pro software (Origin 2024b).
3. RESULTS AND DISCUSSION
3.1. Physiological Response to Biochar
As compared to the residual biochar (S2 and S3), a significant increase in chlorophyll index was reported in fresh biochar (S1) [Figure 1]. Among all the treatments of fresh biochar (S1), a significant increase in leaf chlorophyll index was reported in T9 (14.7%) at 30 DAS, T7 (23%) at 60 DAS, T4 (17.3%) at 90 DAS, and T7 (16.7%) at120 DAS as compared to T2 (100% RDF). In residual biochar treatments (S2), as compared to treatment T2 (100% RDF), a significant increase in chlorophyll index was reported in T6 (9.5%) at 30 DAS, T5 (8.1%) at 60 DAS, and T8 (13.8%, 15.7%) at 90 and 120 DAS, respectively. Similarly in residual biochar (S3), the maximum increase in leaf chlorophyll index was reported inT6 (3.3%) at 60 DAS, T9 (7.2%, 5.3%) at 90 and 120 DAS, respectively, as compared to T2 (100% RDF).
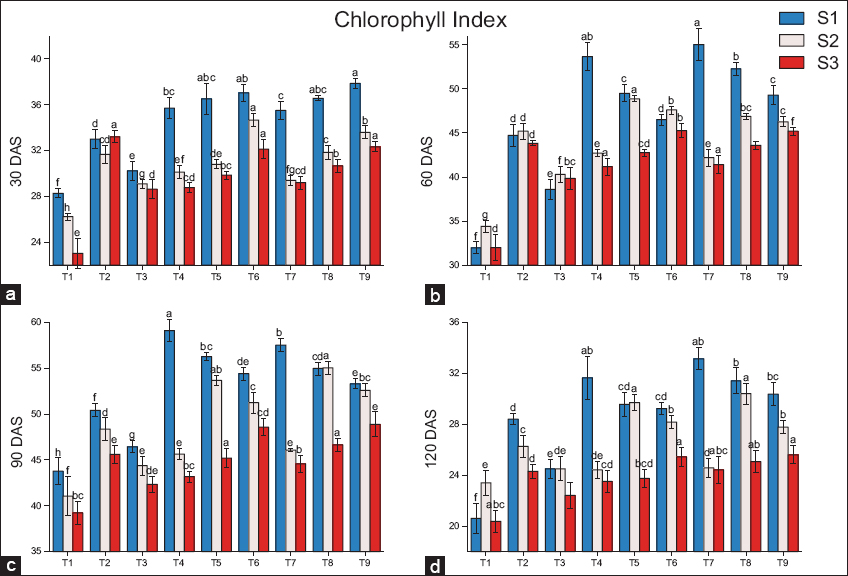 | Figure 1: Effects of biochar application on the chlorophyll index at (a) 30 DAS, (b) 60 DAS, (c) 90 DAS, (d) 120 DAS, (S1) fresh biochar, (S2) one-season-old biochar, and (S3) two-season-old biochar. Different lowercases indicate significant differences between treatments (P < 0.05). [Click here to view] |
Chlorophyll content significantly altered due to application of fresh and residual biochar properties [Figure 2]. In fresh biochar (S1), as compared to T2 (100% RDF), the maximum increase in chlorophyll a content was recorded in T7 (23.9 %) followed by T4 (20.4%) while residual biochar (S2) revealed maximum rises in T9 (11.9%) followed by T6 (8.6 %) as compared to T2. In residual biochar (S3), the maximum chlorophyll a content was recorded in T2. The same trend was followed for chlorophyll b. Fresh biochar (S1) had the maximum increases in T7 (51.6 %) followed by T4 (49.2 %) as compared to T2. In residual biochar (S2), the highest increment was observed in T7 (61.9%), followed by T8 (51.6%) compared to T2. For residual biochar (S3), the maximum increase was recorded in T6 (4.1 %) followed by T9 (1.6 %) as compared to T2. Total chlorophyll content for treatments of fresh biochar (S1) showed maximum increases in T7 (36.6 %) followed by T4 (30 %) as compared to T2. While in residual biochar (S2), the maximum increases were recorded in T9 (8.4 %) followed by T6 (7.1 %) as compared to T2. While in residual biochar (S3), the maximum chlorophyll content was recorded in T2. The results indicate that the fresh biochar had a significant impact over residual biochar on plant chlorophyll content and as compared to the conventional fertilizer application, the biochar-treated plants showed a significant improvement in chlorophyll content [21], which boosts plant photosynthesis and leads toward healthy growth of the plants. Biochar increases plant photosynthesis, the amount of chlorophyll, and the rate of transpiration. Biochar diminishes the effects of drought and salinity on chlorophyll content. Biochar has the ability to alleviate environmental stresses such as drought and salinity that have negative effects on chlorophyll content. Results from the studies show that using new biochar has a considerably higher level of chlorophyll content than when residual biochar is used. Fresh biochar having more chlorophyll content may be magnesium percentage in fresh biochar is more which is central atom of chlorophyll. This improvement results from enhanced nutrient availability, improved soil properties, and reduced environmental stressors [22].
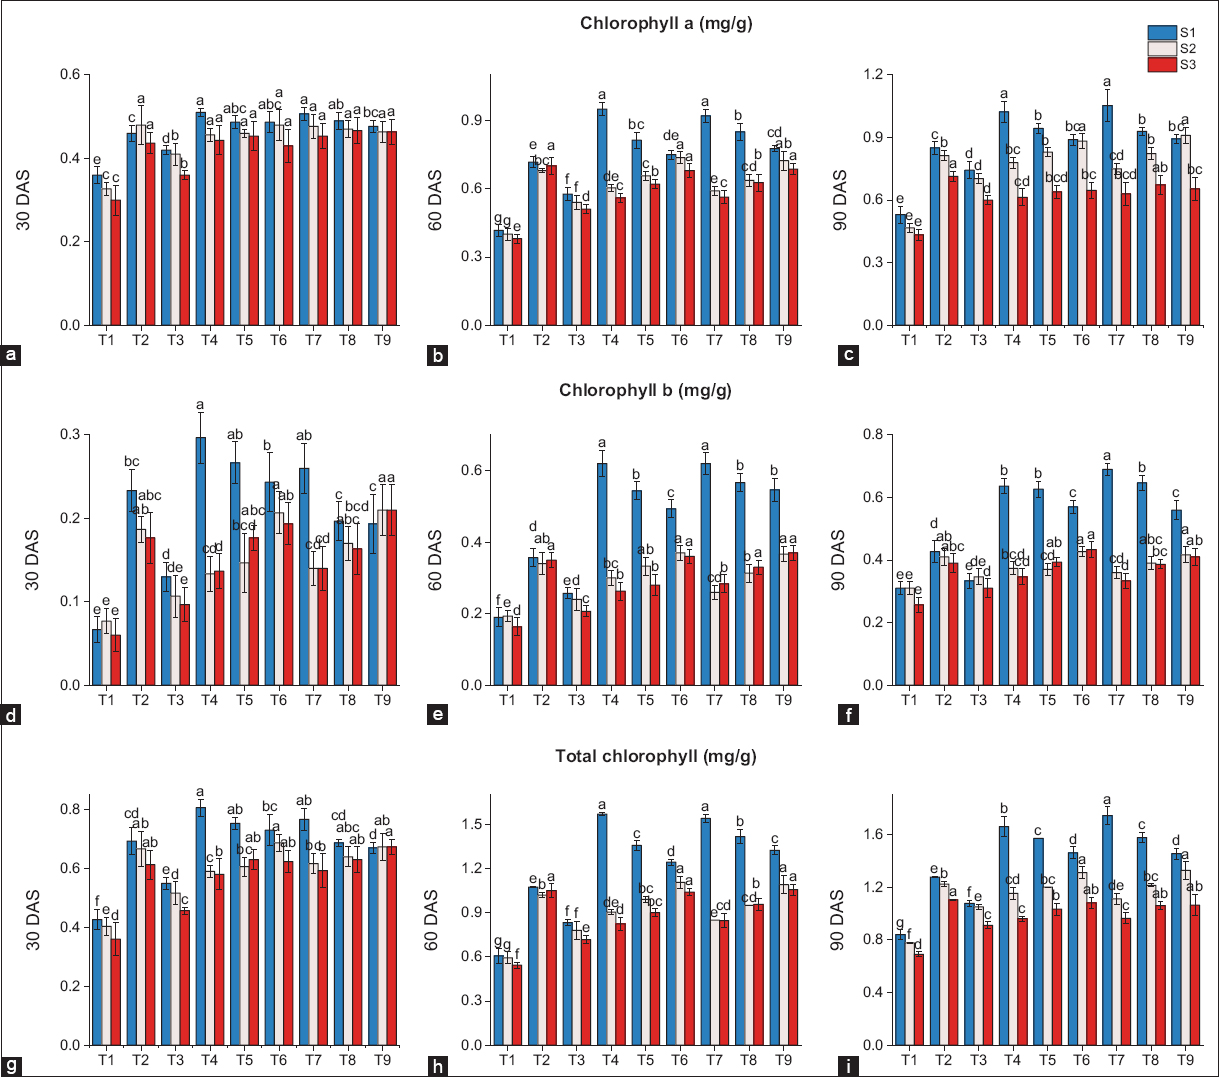 | Figure 2: Effect of biochar application chlorophyll “a” (a) 30 DAS, (b) 60 DAS, (c) 90 DAS chlorophyll “b” (d) 30 DAS, (e) 60 DAS, (f) 90 DAS and total chlorophyll, (g) 30 DAS, (h) 60 DAS, and (i) 90 DAS, (S1) Fresh biochar, (S2) One season old biochar (S3) Two season old biochar. Different lowercases indicate significant differences between treatments (P < 0.05). [Click here to view] |
Fresh biochar (S1) application enhanced RWC in the leaf as compared to residual biochar (S2 and S3). Fresh biochar application significantly affects the RWC of leaves as shown in Figure 3. Compared with T2, the percentage increases of 5%, 9.2%, 9.6% and 10.9% at 30, 60, 90, and 120 DAS, respectively, in T4. While in residual biochar (S2), the maximum RWC was recorded in T5 (i.e., 5.9%, 7.4%, 6.3%, and 14.2% at 30, 60, 90, and 120 DAS, respectively). For two-season-old residual biochar (S3), the maximum RWC was recorded in T9 (i.e., 3.1%, 4.2%, 4.0%, and 7.4% at 30, 60, 90, and 120 DAS, respectively) as compared to T2 (100% RDF).
 | Figure 3: Effects of biochar application on the RWC at (a) 30 DAS, (b) 60 DAS, (c) 90 DAS, (d) 120 DAS, (S1) fresh biochar, (S2) one-season-old biochar, and (S3) two-season-old biochar. Different lowercases indicate significant differences between treatments (P < 0.05). [Click here to view] |
The injury index of the cell membrane is recorded more reduction in S1 as compared to residual biochar (S3 and S2) [Figure 4]. In fresh biochar (S1), compared to the control (T2), the maximum decline in the MII was recorded in T7, with reductions of 27.6% and 30.2% at 30 and 60 DAS, respectively. However, the maximum reduction shifted to T4 at later stages, with decreases of 30.5% and 21.8% at 90 and 120 DAS, respectively. For residual biochar (S2), compared to the control (T2), the maximum decline in the MII was recorded in T8, with a reduction of 4.5% at 30 DAS. However, the maximum reduction shifted to T5 at later stages, with decreases of 2.1%, 7.2%, and 5.3% at 60, 90, and 120 DAS, respectively. For residual biochar (S3), compared to the control (T2), the maximum decline in the MII was recorded in T9, with a reduction of 3.5% at 30 DAS. However, the maximum reduction shifted to T6 at later stages, with decreases of 2.2% and 3.6% at 60 and 90 DAS, respectively. At 120 DAS, the maximum decline in the MII was recorded in T9 (4.8%).
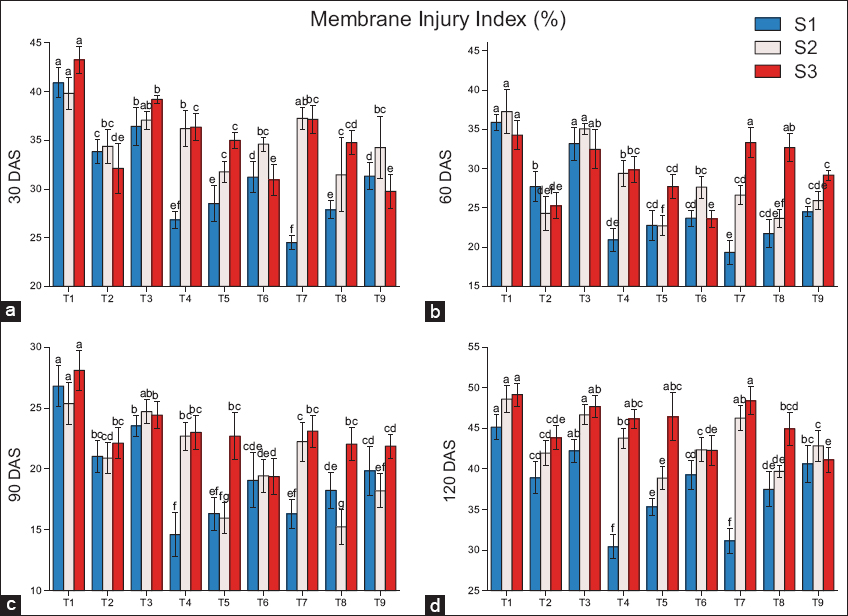 | Figure 4: Effects of biochar application on the membrane injury index at (a) 30 DAS, (b) 60 DAS, (c) 90 DAS, (d) 120 DAS, (S1) fresh biochar, (S2) one-season-old biochar, and (S3) two-season-old biochar. Different lowercases indicate significant differences between treatments (P < 0.05). [Click here to view] |
The application of biochar significantly increased the membrane stability index [Figure 5]. As compared to residual biochar (S2 and S3), the application of fresh biochar significantly impacts cell membrane stability. In fresh biochar (S1), compared to the control (T2), the maximum stability of the cell membrane was recorded in T7, with an increase of 14.1% and 11.6% at 30 and 60 DAS, respectively. However, the maximum increase shifted to T4 at later stages, with decreases of 8.1% and 13.9% at 90 and 120 DAS, respectively. While in residual biochar (S2), the membrane stability increased in T8 (8.5%) at 30 DAS, T5 (6.4%) at 60 DAS, T8 (27.1%) at 90 DAS, and T4 (7.4%) at 120 DAS. While in residual biochar (S3), the maximum percentage increases in membrane stability were recorded in T9 (7.4%) at 30 DAS, shifted to T6 (6.6%, 12.5%) at 60 and 90 DAS, respectively, and T9 (6.2%) at 120 DAS.
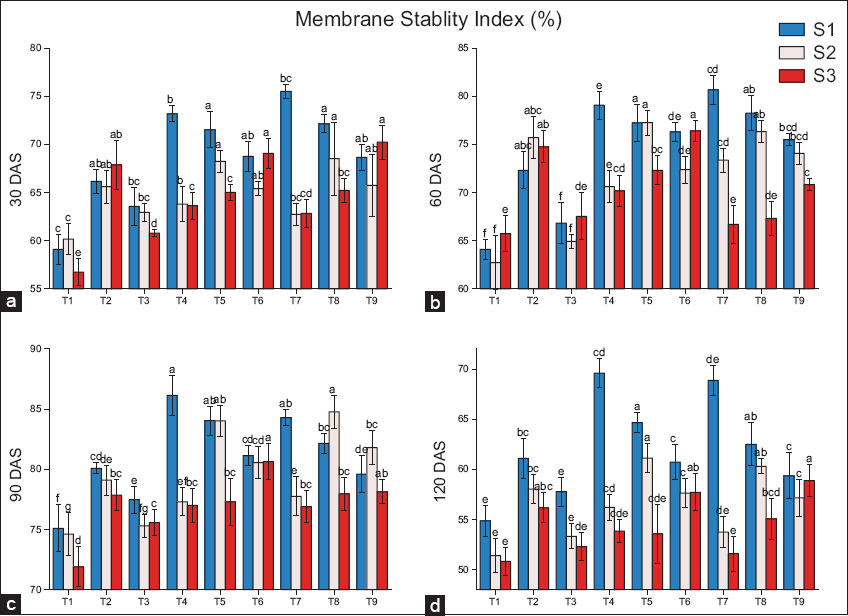 | Figure 5: Effects of biochar application on the membrane stability index at (a) 30 DAS, (b) 60 DAS, (c) 90 DAS, (d) 120 DAS, (S1) fresh biochar, (S2) one-season-old biochar, and (S3) two-season-old biochar. Different lowercases indicate significant differences between treatments (P < 0.05). [Click here to view] |
Relative to the control treatment, the incorporation of biochar affected several physiological parameters in wheat, including RWC, membrane stability index, and MII. The incorporation of biochar promotes plant photosynthesis, boosts chlorophyll levels, and enhances the transpiration rate. Furthermore, biochar application increases wheat node and internode diameter, implying that xylem and phloem tissues have a larger cross-sectional area. This enlargement enables better water and nutrient transfer, potentially increasing plant growth and yield, leading to improved RWC, a higher membrane stability index, or a decrease in cell membrane injury [23]. The present investigation also reports that the biochar treatment enhanced RWC and membrane stability index (MSI). Moreover, it is reported that applying biochar led to an increase in stem robustness and wall thickness in rice varieties by 18–21% and 28–32%, respectively. This enhancement is attributed to the co-deposition of silica, hemicellulose, and lignin within the cell walls, which contributes to improved lodging resistance and overall yield [24]. Fresh biochar increases soil structure, porosity, and water retention immediately after application, but residual biochar may not provide the same long-term advantages. Soil qualities might vary over time owing to numerous variables such as compaction or organic matter decomposition, which may reduce the residual biochar’s capacity.
3.2. Biochar Impact on Grain Composition
A significant increase in total protein, carbohydrate, and gluten content was observed with fresh biochar (S1) application compared to residual biochar (S2 and S3). The protein content in grain was significantly influenced by both fresh and residual biochar amendments in wheat crops [Figure 6]. Compared to the T2 treatment, S1 (fresh biochar) showed the maximum protein increase in T4 (49.9%), followed by T7 (38.1%). Similarly, for residual biochar (S2), the maximum protein percentage increase was recorded in T6 (32.3%), followed by T5 (26.1%). For S3, the highest increase in protein content was recorded in T5 (10.2%), followed by T6 (4.7%) compared to T2.
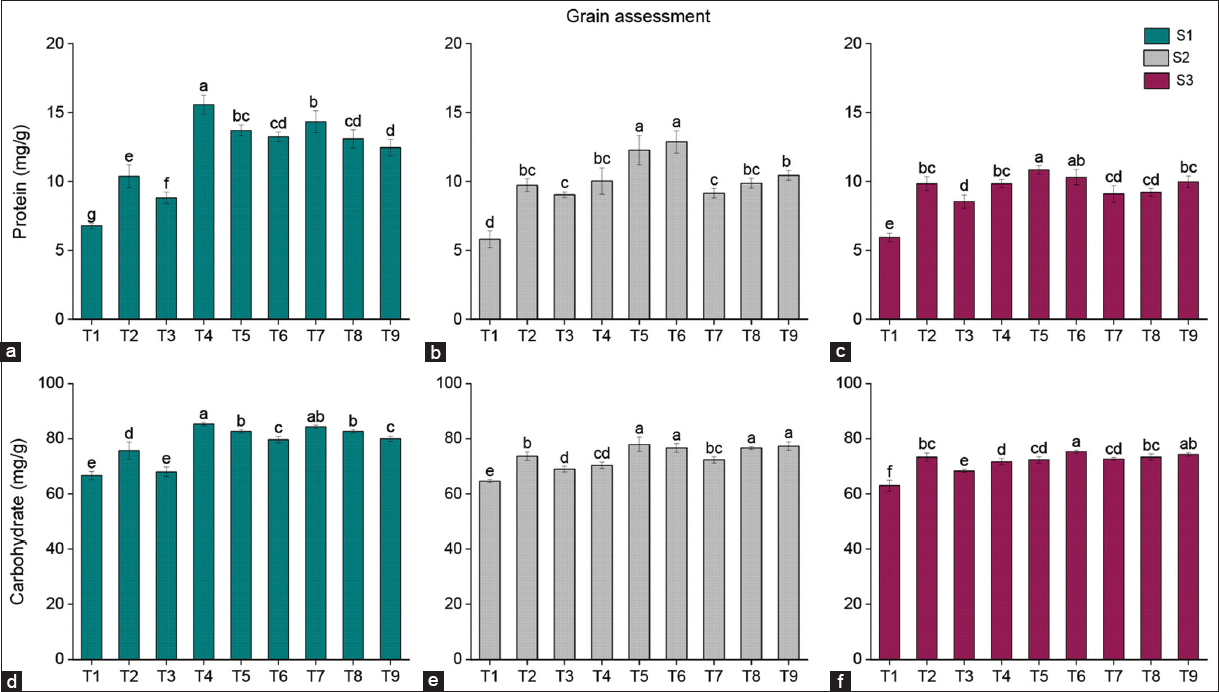 | Figure 6: (a-f) Effects of biochar on protein and carbohydrate contents, (S1) fresh biochar, (S2) one-season-old biochar, and (S3) two-season-old biochar. Different lowercases indicate significant differences between treatments (P < 0.05). [Click here to view] |
Fresh and residual biochar also significantly affected the carbohydrate concentration in grain. Compared to T2, fresh biochar (S1) resulted in the highest carbohydrate increase in T4 (12.7%) followed by T7 (11.4%). Among residual biochar treatments, S2 showed the greatest increase in T5 (5.9%) followed by T9 (5%), while S3 exhibited the maximum increase in T6 (2.7%) followed by T9 (1.4%) compared to T2.
The quality of wheat grain is closely linked to its protein and carbohydrate levels, and research has shown that applying biochar enhances the protein levels in wheat grain [25,26]. In addition, the use of biochar led to a notable increase in nitrogen content in the grain [27,28]. Furthermore, the application of biochar bolstered protein levels, attributed to the substantial nitrogen accumulated in the grains or to the improved nitrogen utilization efficiency in the plants. The disproportionate rise in vegetative growth compared to carbohydrate translocation may compromise wheat grain quality. Biochar optimizes this equilibrium by increasing soil fertility, boosting nutrient and water availability, and reducing stress. This optimization ensures a balanced carbohydrate allocation to grains, which supports increased production and quality through higher starch concentration and composition [29]. However, the aging of biochar may impact its physical and chemical properties, reducing its ability to retain and release nutrients effectively. However, the ageing of biochar may affect its physical and chemical properties, limiting its ability to hold and release nutrients efficiently.
In comparison to T2, fresh biochar (S1) showed the highest concentration of wet gluten in T7 (20.9%) followed by T4 (18.5%). S2 demonstrated the maximum increase in T9 (11.2%), with T8 coming next at 9.4%, relative to T2 [Figure 7]. The residual biochar (S3) also influenced the gluten content in wheat when compared to T2, with the most significant increases seen in T9 (14.3%) and T6 (11.3%). The dry gluten content followed a similar pattern, with the maximum increase observed in T4 of fresh biochar application (45.4%) followed by T5 (37.5%). In contrast to T2, residual biochar significantly enhanced the dry gluten content in T6 (22%), and T7 had an increase of 13.5%. In comparison to T2, the residual effect of biochar S3 showed the most significant rise in T9 at 3.1%, followed closely by T6 at 2.7%. Gluten is a complex mixture of proteins found in wheat, and nitrogen fertilizer is one of the key factors influencing gluten content [28]. The amendment of biochar, which can hold and release nitrogen, might have a significant effect on gluten content [30]. In the present study, biochar significantly increased the amount of wet gluten. In this study, a trend toward increased gluten amounts with biochar application was observed. Fresh biochar performs better initially because it serves as a fertilizer, delivering nutrients, but its physical and chemical qualities change over time. Optimizing biochar application and nitrogen control is critical for increasing gluten content and overall wheat quality.
 | Figure 7: (a-f) Effects of biochar on the effects of wet and dry gluten on grain quality. (S1) Fresh biochar, (S2) one-season-old biochar, and (S3) two-season-old biochar. Different lowercases indicate significant differences between treatments (P < 0.05). [Click here to view] |
3.3. Principal Component Analysis (PCA) Analysis
The biplot analysis revealed the interactions between different parameters and the respective treatments. Fresh biochar (S1) [Figure 8] related to PC1 and PC2 reflecting 98.5%, while residual biochar (S2) [Figure 9] 95.7% and residual biochar (S3) [Figure 10] 96.36% divergence in the observations. The first two components were geometrically represented in a Cartesian coordinate system, constructing a dimensional reduction framework to identify prominent discriminatory variables in the observation data. Fresh biochar (S1) In coordinate-1 T6, T7, T8, and T9 were clustered where vectors gluten (GLT), carbohydrate (CRB), and total chlorophyll (CHT) are showing, ensuring the strong bonding of gluten, carbohydrate, and total chlorophyll content with T6, T7, T8, and T9. Residual biochar (S2) In coordinate-1 T6, T9, and T2 were clustered where vectors Total Protein (PRT), GLT, CRB, and CHT are projecting, showing the great association of protein, gluten, carbohydrate, and total chlorophyll content with T6, T2, and T9. Residual biochar (S3) In coordinate-1 T5 was clustered where vectors PRT, GLT, CRB, and CHT are projecting, confirming the strong association of protein, gluten, carbohydrate, and total chlorophyll content with T5.
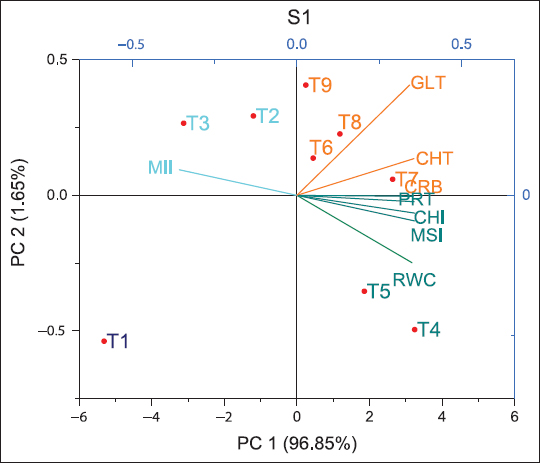 | Figure 8: Two-dimensional principal component analysis ordination plot sowing the multivariate between experimental treatments and 8 traits on the first two axes. CHI: Chlorophyll index at 90 DAS, CHT: Total chlorophyll content at 90 DAS, MSI: Membrane stability index at 90 DAS, MII: Membrane injury index at 90 DAS, RWC: Relative water content at 90 DAS, CRB: Grain carbohydrate mg/g, PRT: Total protein mg/g, GLT: Gluten mg/g, principal component, that is, PC1 and PC2, S1: Fresh biochar, S2: One season old residual biochar, S3: Two seasons old residual biochar. [Click here to view] |
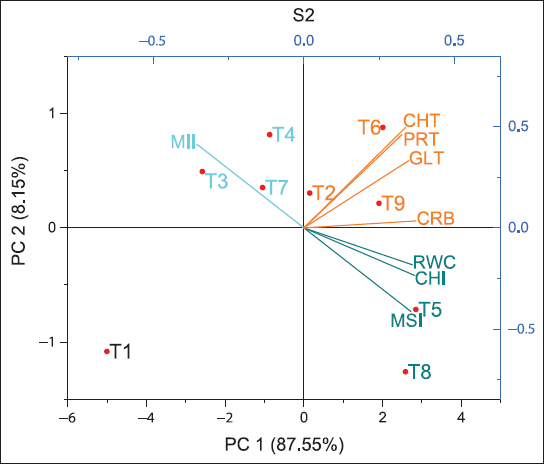 | Figure 9: Two-dimensional principal component analysis ordination plot sowing the multivariate between experimental treatments and eight traits on the first two axes. CHI: Chlorophyll index at 90 DAS, CHT: Total chlorophyll content at 90 DAS, MSI: Membrane stability index at 90 DAS, MII: Membrane injury index at 90 DAS, RWC: Relative water content at 90 DAS, CRB: Grain carbohydrate mg/g, PRT: Total protein mg/g, GLT: Gluten mg/g, principal component, that is, PC1 and PC2, S1: Fresh biochar, S2: One season old residual biochar, S3: Two seasons old residual biochar. [Click here to view] |
 | Figure 10: Biplot for the different treatments and 8 traits along the first 2 principal components. CHI: Chlorophyll index at 90 DAS, CHT: Total chlorophyll content at 90 DAS, MSI: Membrane stability index at 90 DAS, MII: Membrane injury index at 90 DAS, RWC: Relative water content at 90 DAS, CRB: Grain carbohydrate mg/g, PRT: Total protein mg/g, GLT: Gluten mg/g, principal component, that is, PC1 and PC2, S1: Fresh biochar, S2: One season old residual biochar, and S3: Two seasons old residual biochar. [Click here to view] |
PCA is a statistical method used to extract significant information from high-dimensional data to low-dimensional data. It is a very effective way to group highly correlated variables [33]. This research used PCA to describe treatments, examine the relationships between traits, and discriminate treatments efficiently. Researchers have used PCA extensively for various traits in similar applications [34-36]. PCA has also been used to analyze and categorize different Bambara groundnut genotypes according to agro-morphological characteristics and fruit quality. Here, we optimize fresh and residual biochar treatment at different doses for wheat production. The PCA of treatments S1, S2, and S3 revealed a clear pattern, with fresh biochar having a greater favorable effect on plant physiology than both the control and residual biochar. This shows that fresh biochar improves plant physiological processes more than old or residual biochar. The PCA results revealed that fresh biochar treatments were significantly associated with improved plant physiology. In contrast, as biochar ages, its physical and chemical properties alter. This is reflected in the PCA analysis, which revealed that aged biochar treatments had a poorer correlation with plant physiological measures, indicating a reduction in biochar effectiveness over time.
4. CONCLUSION
Finally, this research work explains how biochar improves wheat growth and quality. Fresh biochar has fertilizer-like qualities, producing the best effects at a rate of 5 t/ha. In contrast, residual biochar is effective at greater doses, with one-season-old biochar exhibiting substantial effects at 10 t/ha and two-season-old biochar at 15 t/ha. Biochar’s ability to absorb and deliver nutrients improves plant physiological characteristics and grain quality. The high potassium concentration of biochar minimizes the need for additional potassium fertilizers, particularly with a 10 t/ha application rate after one season. While biochar’s effectiveness fades over time, its residual effects demonstrate its potential as a long-term strategy for optimizing nutrient management and reducing fertilizer inputs. For practical agricultural uses, a biochar application dose of 5 t/ha is regarded as the ideal dosage, with significant benefits to wheat growth and quality. The study on biochar’s effects on wheat has limitations. Its applicability may vary across climates and soil types, and scalability in practical agriculture is uncertain. In addition, environmental sustainability concerns, such as production and transportation impacts, need consideration to ensure biochar use aligns with broader environmental goals. Biochar application reduces the need for chemical fertilizers through increasing nutrient use efficiency and it reduces greenhouse gas emissions through carbon sequestration.
5. ACKNOWLEDGMENTS
This research is the outcome of the Aakash Project (Project No. 14200133), which is financially supported by the Research Institute for Humanity and Nature, Japan (RIHN: a constituent number of NIHU). The author acknowledges the cooperation of the present leader, Dr. Prabir Patra and all members of the Aakash Project. The author also acknowledges the support of CIF, and LPU, for providing the necessary instrumentation for sample analysis.
6. AUTHORS’ CONTRIBUTIONS
All authors made substantial contributions to conception and design, acquisition of data, or analysis and interpretation of data; took part in drafting the article or revising it critically for important intellectual content; agreed to submit to the current journal; gave final approval of the version to be published; and agreed to be accountable for all aspects of the work. All the authors are eligible to be an author as per the International Committee of Medical Journal Editors (ICMJE) requirements/guidelines.
7. CONFLICTS OF INTEREST
The authors report no financial or any other conflicts of interest in this work.
8. ETHICAL APPROVALS
This study does not involve experiments on animals or human subjects.
9. DATA AVAILABILITY
The datasets generated during and/or analyzed during the current study are available from the corresponding author on reasonable request.
10. PUBLISHER’S NOTE
All claims expressed in this article are solely those of the authors and do not necessarily represent those of the publisher, the editors and the reviewers. This journal remains neutral with regard to jurisdictional claims in published institutional affiliation.
11. USE OF ARTIFICIAL INTELLIGENCE (AI)-ASSISTED TECHNOLOGY
The authors declares that they have not used artificial intelligence (AI)-tools for writing and editing of the manuscript, and no images were manipulated using AI.
REFERENCES
1. Food and Agricultural Organization of the United Nations FAOSTAT Statistics Database (FAO);2021. Available from:https://www.fao.org/faostat/en/#data/QCL
2. Gadde B, Menke C, Wassmann R. Rice straw as a renewable energy source in India, Thailand, and the Philippines:Overall potential and limitations for energy contribution and greenhouse gas mitigation. Biomass Bioenergy. 2009;33(11):1532-46. [CrossRef]
3. Tirol-Padre A, Ladha JK, Regmi AP, Bhandari AL, Inubushi K. Organic amendments affect soil parameters in two long-term rice-wheat experiments. Soil Sci Soc Am J. 2007;71(2):442-52. [CrossRef]
4. Aggarwal PK, Talukdar KK, Mall RK. Potential Yields of Rice-Wheat System in the Indo-Gangetic Plains of India. Facilitation Unit, Rice-Wheat Consortium for the Indo-Gangetic Plains. Consortium Paper Series;2000. 16.
5. Chandra BP, Sinha V. Contribution of postharvest agricultural paddy residue fires in the N.W. Indo-Gangetic Plain to ambient carcinogenic benzenoids, toxic isocyanic acid and carbon monoxide. Environ Int. 2016;88:187-97, 277. [CrossRef]
6. Korav S, Rajanna GA, Yadav DB, Paramesha V, Mehta CM, Jha PK, et al. Impacts of mechanized crop residue management on rice-wheat cropping system-A review. Sustainability. 2022;14:15641. [CrossRef]
7. Silalertruksa T, Gheewala SH, Sagisaka M, Yamaguchi K. Life cycle GHG analysis of rice straw bio-DME production and application in Thailand. Appl Energy. 2013;112:560-7. [CrossRef]
8. Gadde B, Bonnet S, Menke C, Garivait S. Air pollutant emissions from rice straw open field burning in India, Thailand and the Philippines. Environ Pollut. 2009;157(5):1554-8. [CrossRef]
9. Pathak H, Saharawat YS, Gathala M, Ladha JK. Impact of resource-conserving technologies on productivity and greenhouse gas emissions in the rice-wheat system. Green Gases Sci Technol. 2010;1:261-77. [CrossRef]
10. Zhang Y, Wang J, Feng R. The effects of biochar addition on soil physicochemical properties:A review. Catena. 2021;202:105284. [CrossRef]
11. Jey Subramanian K, Thangagiri B, Sakthivel A, Raja JD, Seenivasan S, Vallinayagam P, et al. Complete review on biochar:Production, property, multifaceted applications, interaction mechanism and computational approach. Fuel. 2021;292:120243. [CrossRef]
12. Yu H, Zou W, Chen J, Chen H, Yu Z, Huang J, et al. Biochar amendment improves crop production in problem soils:A review. J Environ Manag. 2019;232:8-21. [CrossRef]
13. Weber K, Quicker P. Properties of biochar. Fuel. 2018;217:240-61. [CrossRef]
14. Pariyar P, Kumari K, Jain MK, Jadhao PS. Evaluation of change in biochar properties derived from different feedstock and pyrolysis temperatures for environmental and agricultural applications. Sci Total Environ. 2020;713:136433. [CrossRef]
15. Seleiman MF, Hafez EM. Optimizing inputs management for sustainable agricultural development. In:Mitigating Environmental Stresses for Agricultural Sustainability in Egypt. Cham, Switzerland:Springer;2021. 487-507. [CrossRef]
16. Gao S, DeLuca TH. Influence of biochar on soil nutrient transformations, nutrient leaching, and crop yield. Adv Plants Agric Res. 2016;4(5):150. [CrossRef]
17. Barrs HD. Determination of water deficits in plant tissues. In:Kozlovski TT, editor. Water Deficits and Plant Growth. Vol. 1. New Delhi:Academic Press;1968. pp. 235-368.
18. Premachandran GS, Saneoka H, Ogata S. Cell membrane stability, an indicator of drought tolerance as affected by applied nitrogen in soybean. J Agric Sci. 1990;1:63-6. [CrossRef]
19. AOAC. Official Methods of Analysis of the AOAC. 18th ed. Washington, DC:AOAC;2000.
20. AACC. Approved methods of the American Association of Cereal Chemists. St Paul, MN:AACC;2000.
21. Duan S, Al-Huqail AA, Alsudays IM, Younas M, Aslam A, Shahzad AN, et al. Effects of biochar types on seed germination, growth, chlorophyll contents, grain yield, sodium, and potassium uptake by wheat (Triticum aestivum L.) under salt stress. MC Plant Biol. 2024;24(1):1-14. [CrossRef]
22. Meng X, Liang Y, Zou Z, Wang R, Su Y, Gong X, et al. Effects of biochar application on stem and lodging characters of rice in the rice-duck farming system. Chin J Ecol. 2021;40:3125-4.
23. Laird DA, Fleming P, Davis DD, Horton R, Wang B, Karlen DL. Impact of biochar amendments on the quality of a typical Midwestern agricultural soil. Geoderma. 2010;158(3-4):443-9. [CrossRef]
24. Miao W, Li F, Lu J, Wang D, Chen M, Tang L, et al. Biochar application enhanced rice biomass production and lodging resistance via promoting co-deposition of silica with hemicellulose and lignin. Sci Total Environ. 2023;855:158818. [CrossRef]
25. Khan MA, Basir A, Fahad S, Adnan M, Saleem MH, Iqbal A, et al. Biochar optimizes wheat quality, yield, and nitrogen acquisition in low fertile calcareous soil treated with organic and mineral nitrogen fertilizers. Front Plant Sci. 2022;13:879788. [CrossRef]
26. Litke L, Gaile Z, Ruža A. Effect of nitrogen fertilization on winter wheat yield and yield quality. Agron Res. 2018;16:500-9.
27. Ali K, Arif M, Jan MT, Khan MJ, Jones DL. Integrated use of biochar:A tool for improving soil and wheat quality of degraded soil under wheat-maize cropping pattern. Pak J Bot. 2015;47:233-40.
28. Major J, Rondon M, Molina D, Riha SJ, Lehmann J. Maize yield and nutrition during 4 years after biochar application to a Colombian savanna oxisol. Plant Soil. 2010;333:117-28. [CrossRef]
29. Sarwar N, Abbas N, Farooq O, Akram M, Hassan MW, Mubeen K, et al. Biochar integrated nutrient application improves crop productivity, sustainability and profitability of maize-wheat cropping system. Sustainability. 2023;15(3):2232. [CrossRef]
30. Wyzi?ska M, Berbe?AK, Grabi?ski J. Impact of biochar dose and origin on winter wheat grain quality and quantity. Agriculture. 2023;14(1):39. https://doi.org/10.3390/agriculture14010039 [CrossRef]
31. Arnon DI. Copper enzymes in isolated chloroplasts, polyphenol oxidase in Beta vulgaris. Plant Physiol. 1949;1:1-15. https://doi.org/10.1104/pp.24.1.1 [CrossRef]
32. Bureau of Indian Standards (BIS). IS 7219:Method for Determination of Protein In Foods and Feeds. New Delhi:Bureau of Indian Standards;1973.
33. Cheng C. Principal Component Analysis (PCA) Explained Visually with Zero Math. California:Medium, Towards Data Science;2022.
34. Samec D, Maretic M, Lugaric I, Mesic A, Salopek-Sondi B, Duralija B. Assessment of the differences in the physical, chemical and phytochemical properties of four strawberry cultivars using principal component analysis. Food Chem. 2016;194:828-34. [CrossRef]
35. Park MJ, Ryu DH, Cho JY, Lee DG, Lee JN, Kang YH. Potential for antioxidant and antihyperglycemic activities of four everbearing strawberry cultivars. Hortic Environ Biotechnol. 2020;61:615-23. [CrossRef]
36. Pinheiro DF, Resende JT, Constantino LV, Hata FT, Hata NN, Lustosa SB. Physical, biochemical, and sensory properties of strawberries grown in high-altitude tropical climate. Cienc E Agrotecnol. 2021;45:e008221. [CrossRef]