
1. INTRODUCTION
Lectins are recognized as glycan-binding proteins and serve crucial roles in various biological processes [1]. With two active sides that bind to carbohydrates, lectins have the capability to clump together cells displaying these compounds on their surface. This unique property has led to lectins being referred to as agglutinins or hemagglutinins. However, the mechanism of cell clumping differs from immunoglobulins, therefore lectins are called non-immune proteins. The cell clumping ability of lectin makes it pharmacologically useful as a preventive agent against autoimmune diseases functioning as an anti-tumor, antimicrobial, and anti-malarial, etc. Lectins are derived from plants, animals, and bacteria; meanwhile, plants are the largest sources and are widely used for isolation and analysis of different molecules. In plants, they are found in seeds, leaves, bark, roots, rhizomes, and fruits [2].
Colocasia esculenta, known as taro, contains lectins which are synthesized in the rhizome [3]. Taro is a tropical, annual herbaceous plant of the Aracea family, and the rhizome is used as food, antibacterial, anti-inflammatory, antitumoral, antimutagenic, immunomodulatory, antioxidant, anti-hyperglycemic, and anti-hyperlipidemic [4-6]. In addition, several studies have also shown that taro flour can be utilized in food packaging industry applications as a low-cost biopolymer and flour modification with cold plasma treatment [7,8]. The rhizomes are abundant in fibers, starch granules, mucilage, and bioactive phytochemicals such as sterols, alkaloids, flavonoids, tannins, and micronutrients [9]. One of the lectins found in C. esculenta rhizomes is tarin in the form of α-D-mannose which consists of two heterodimers. Each heterodimer has homologous monomers with sizes of ~11.9 (chain A) and ~12.7 (chain B) kDa. Every monomer of tarin creates a conventional β-prism II fold. Domain switching between the β-strand on face I of the prism and the C-terminal β-strand forms heterodimers. Tetramers are put together by dimerizing the heterodimer’s B chain, which involves the surface II of every prism. This loop may give members of the Galanthus nivalis agglutinin (GNA)-related lectin family selectivity when it comes to binding carbohydrates because it is different in size and amino acid content from the other 10 β-prism II domain proteins [10]. Tarin which is a lectin related to GNA. This compound accumulates in large quantities within the vacuole of C. esculenta [10] and stimulates the adaptive and innate response of the immune, allowing the host to mask from infection or the immunosuppressed status inherent in some pathological conditions. The reversible and specific binding of lectins to carbohydrates in several cell types causes tarin to exhibit activities such as antibacterial, antifungal, antiviral, anti-tumor, insecticidal, and stimulation of mitogenic lymphocytes [11].
There have been many studies on the development and purification of lectins in recent years. At present, lectins are used as reagents for biopharmaceutical diagnostics and drugs, specifically those derived from plants. They are expected to become therapeutic agents in the future and a product of the biopharmaceutical industry, specifically monoclonal antibodies [12] though it has anti-nutritional effects. Da Silva et al. reported that lectins from Parkia platycephala seeds showed negative effects on biochemical parameters and fish growth when used as fish feed [13]. Therefore, optimizing the separation and purification of plant-derived lectins is necessary to harness their therapeutic potential and utilize plants, such as taro, without any negative effects. The separation and purification are conducted by extracting plants using precipitation methods with salt and phosphate buffer saline (PBS). Purification is carried out using affinity gel and ion exchange chromatography [12].
However, there are limited studies on the optimal methods for extracting and isolating active proteins from C. esculenta rhizomes. According to the description above, this study was conducted to determine the optimal conditions for purifying and isolating lectins from C. esculenta rhizomes.
2. MATERIALS AND METHODS
2.1. Plant Materials and Equipment
C. esculenta rhizomes were obtained from the Horticultural Plant producer, South Bogor. The rhizomes were about 5–8 months old and the plants were identified at the Herbarium Bogoriense, Directorate of Scientific Collection Management, BRIN Cibinong, Indonesia. The materials include Cytiva HiTrapTM DEAE-FF 5 mL, 2% rabbit red blood cells, NaCl 0.85%, high-speed refrigerated centrifuge, Micropipet (Thermo Scientific), sodium dodecyl sulfate-polyacrylamide gel electrophoresis (SDS-PAGE) (ATTO Corporation), Waterbath B-480 (BUCHI), Centrisart A-14 (Sartorius), Seesaw Shaker WSC-2400 (ATTO), SYNERGY HTX Multi-mode reader (BioTek), incubator shaker (Heidolph UNIMAX 1010), ÄKTA™ start protein purification (GE) with UV detector and HiTrap DEAE-FF analytical column, 96-well microplate, and V-bottom plate (NEST).
2.2. Methods
2.2.1. Preparation of crude extract
a. Salting in with NaCl
To prepare the mixture, fresh C. esculenta rhizomes weighing 50 g were washed, peeled, and sliced. They were then combined with 0.2 mol/L NaCl solution containing 1 g/L ascorbic acid at a ratio of 10 mL/g of fresh weight. After filtration, the homogenate was centrifuged at 3000× g for 10 min. Then, to the supernatant was added 20 mmol/L CaCl2, the pH was adjusted to 9.0 with 1 mol/L NaOH, and the suspension was left overnight at <4°C. This was centrifuged at 3000× g for 10 min and collected the supernatant, adjusted to a pH of 4.0 with 1 mol/L HCl, and centrifuged at 3000× g for 10 min. The clear solution (S1) was adjusted to a pH of 7.5 with 1 mol/L NaOH, left overnight in a refrigerator at <4°C to precipitate, and the precipitate formed was centrifuged at 9000× g for 20 min. Furthermore, the resulting supernatant (A1) was collected and stored in a refrigerator at −20°C. The extraction of taro rhizomes using the salting in method refers to Jebor et al. [14] with modifications.
b. Salting in followed by salting out methods
A portion of the S1 solution was added to solid ammonium sulfate until a final concentration of 1 mol L-1. The mixture was left in the refrigerator overnight at <4°C and centrifuged at 9000 × g for 20 min. Then, the supernatant (B1) and precipitate (B2) were collected and stored in a freezer at −20°C. The extraction of taro rhizomes using the salting in followed by the salting out method refers to Jebor et al. [14] with minor modifications.
c. Addition of PBS
PBS was used to homogenize 60 g of taro rhizomes at 7.2 pH at a ratio of 1:5 (w/v). The mixer was used to stir and the product was stored overnight (<4°C). Furthermore, the extract was filtered and the filtrate was centrifuged at 20,000 × g for 35 min at 4°C. Then, the supernatant (C1) and precipitate (C2) were collected and stored at <−20°C [15].
2.2.2. SDS-PAGE analysis
a. SDS-PAGE Preparation
Preparation of Resolving gels: Aquades (4.9 mL) and 6.0 mL of 30% Acrylamide/Bis Solution 19:1 was mixed. Then, 3.8 mL of 1.5 mol L-1 Tris Buffer (pH 8.8), 0.15 mL of 10% SDS, 0.15 mL of ammonium persulfate 10%, and 30 μL tetramethylenediamine (TEMED) were added. The solution was stirred until it was homogeneous. Then, 6 mL of the solution was transferred into the SDS-PAGE device and allowed to freeze. Preparation of Stacking gels: Aquadest (4.1 mL) was added to 1 mL of 30% acrylamide/Bis Solution 19:1. Furthermore, 750 μL of 1.5 mol L-1 Tris Buffer (pH 6.8), 60 μL of 10% SDS, 60 μL of 10% ammonium persulfate, and 25 μL of TEMED were added. The solution was shaken until it was homogeneous and transferred into the SDS-PAGE tool. Then, the mold was placed into the SDS-PAGE device. The SDS-PAGE analysis procedure followed that of Roy and Kumar [16], with minor modifications.
b. SDS-PAGE Electrophoresis
The electrophoresis procedure refers to Jiang et al. [17] and Jawade et al. [18] with slight modifications. Crude extract samples, A1, B1, B2, C1, and C2, were mixed with Coomassie brilliant blue loading dye in a ratio of 5:1 and heated in a water bath at 95–100°C for 5 min. A total of ± 20 μL of protein solution sample and 5 μL of Pageruler Plus Prestained Protein Ladder marker were added to the well. The process used the electrophoresis unit with constant voltage in a standard mode of 21 mA/gel for ±1 h 45 min on the ATTO WSE-1150 PageRun Ace device. Furthermore, the gel was observed in Coomassie brilliant blue R-250 staining solution (Bio-rad) for 30 min. Then, the staining solution was replaced with Coomassie brilliant blue R-250 Destaining solution (Bio-rad) overnight for gel washing.
2.2.3. Isolation and purification of lectin compounds using ion exchange chromatography
Isolation and purification were performed on sample C1 using a 5 mL HiTrapTM DEAE-FF column and a flow rate of 1.0 mL min-1. This refers to the method of Jebor and Jalil [14] with minor modifications. Optimization using three buffer pH conditions: 0.01 mol L-1 Tris-HCI for pH of 8.3 and 9.6, and PBS buffer for pH of 7.2. Sample C1 was dialyzed against each buffer and loaded on a 5 mL HiTrap DEAE-FF analytical column equilibrated with the same buffer. The column was connected to the ÄKTA™ start protein purification device (and other conditions using general standard operating procedure), and the adsorbed lectin proteins were eluted using 0.3 M NaCl solution in each buffer.
2.2.4. Determination of total protein content using the bicinchoninic acid (BCA) method
The crude extract sample (25 μL) was pipetted into a 96-well microplate, and then, 200 μL of working reagent of BCA and standard solution were added. The solution was stirred for 30 s and incubated at 37°C for 30 min. Furthermore, the absorbance was calculated at 562 nm using the synergy htx multimode reader-Gen5 3.08 software application. The test was replicated 3 times, and the standard curve and concentration of the samples were obtained [19].
2.2.5. Hemagglutination test for lectin identification
A 96-well V bottom microplate was mixed with 2% rabbit red blood cells and the sample concentration series of 4–1 μg mL-1 in PBS. The solution was incubated for 1 h at room temperature and observed visually. Positive results of the agglutination reaction were indicated by a uniform red color in the solution, while negative results showed a red dot precipitate [18].
3. RESULTS AND DISCUSSION
3.1. Crude Extract and SDS-PAGE
The extraction of taro rhizomes using three methods produced five crude extracts, namely A1 is the supernatant from the salting in method, B1 and B2 are the supernatant and precipitate from the salting in method followed by salting out, and C1 and C2 are the supernatant and precipitate from the extraction using PBS solvent. The separation and purification of lectins are carried out using methods such as salt or acid precipitation, solvent extraction, and chromatography, including ion exchange and affinity chromatography. The results showed that the crude extract with phosphate buffer saline (C1) was the most optimal. This was confirmed by analysis using SDS-PAGE, where the most intense band at a molecular weight of 12.5 kDa in sample C1 was detected compared to the other four extracts [Figure 1]
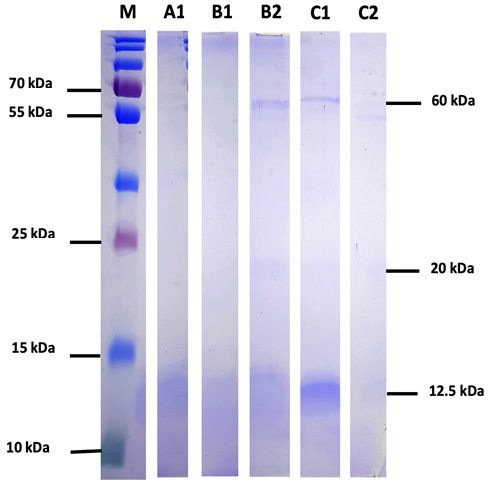 | Figure 1: Results of Analysis of Taro rhizome crude extract using sodium dodecyl sulfate-polyacrylamide gel electrophoresis. M: Marker, A1: Supernatant salting in, B1: Supernatant salting in and salting out, B2: Precipitate salting in and salting out, C1: Supernatant with PBS, C2: Precipitate with phosphate buffer saline solvent, kDa: kilo Dalton. [Click here to view] |
The SDS-PAGE analysis showed that C1 contained proteins with molecular weights of ~60 kDa, 20 kDa, and ~12.5 kDa scattered in each extract. SDS-PAGE analysis was used to identify the lectin protein to be isolated based on its molecular weight and to qualitatively determine the protein with the highest concentration from the intensity of the resulting bands. In the SDS-PAGE analysis of C. esculenta, a band with a molecular weight of 12.5 kDa [3] was observed.
3.2. Purification of Lectin Compounds using Ion Exchange Chromatography
Based on the SDS-PAGE results, C1 showed the clearest band [Figure 1], hence lectin purification was continued using Ion Exchange Chromatography (weak anion exchange resin) isocratically. The first stage of purification was pH optimization at a pH of 8.3, 7.6, and 9.6, with the results in Figure 2.
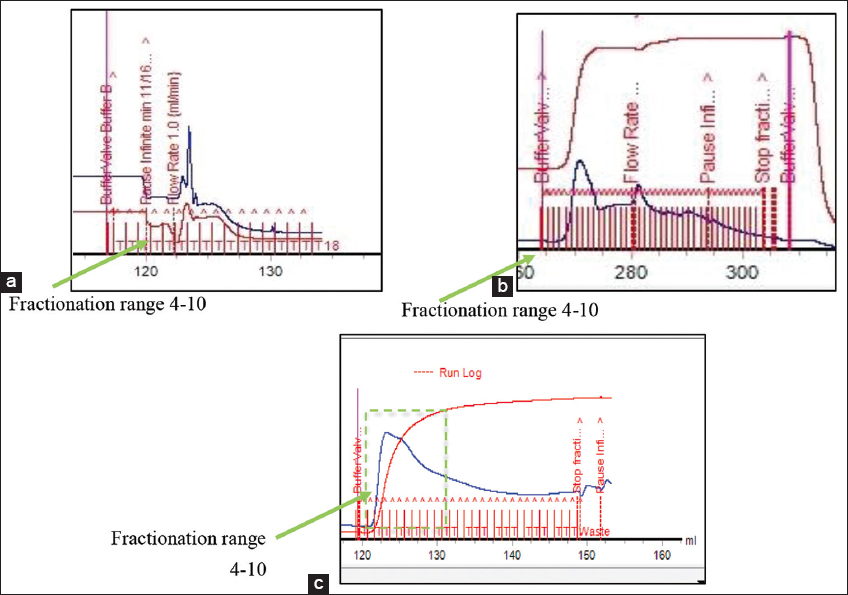 | Figure 2: Purification results of sample C1 using Ion exchange chromatography with three pH points: (a). pH 8.3; (b). pH 7.2; (c). 9,6. [Click here to view] |
From the purification results at pH 8.3, the highest peak was obtained in fractions 1–5 [Figure 2a]. Similarly, at pH 7.2, the highest peak was observed in fractions 7–15 [Figure 2b], and at pH 9.6, it was obtained in fractions 4–15 [Figure 2c]. Based on the SDS-PAGE analysis of crude extract samples, sample C1 was selected for protein separation and purification using ion-exchange chromatography because proteins are charged compounds and are separated according to their charge (ions) using either an an-ion exchange or cation exchange resin [20]. Furthermore, ion exchange chromatography separates molecules based on their type and strength of charge. At pH values above the isoelectric point (PI), proteins carry a negative charge and bind to a positively charged resin (anion exchange).
Ion exchange resins are divided into four types: Strong anions, weak anions, strong cations, and weak cations. Each type has distinct properties and functions and is selected based on the target and sample used. The ionic strength and buffer pH are vital in protein separation. According to Roy et al. [21], increasing the ionic strength of the mobile phase optimizes elution profiles more effectively than pH changes. However, the appropriate pH is important for binding the desired protein, as this determines the type of resin to be used. The ionic strength of the sample and variations in buffer pH are essential in achieving high resolution and effective separation. Based on the pH optimization results, the optimal separations were obtained at pH 9.6, which is appropriate for determining optimization using PI. Although most lectins have a wide pH range of 1–14, those from different sources have different ranges, such as Parkia javanica beans with an optimal pH range of 7–10 [22]. The optimization of pH was conducted by determining the PI of the protein from the sequence of lectin compounds described by Das et al. [3]. After obtaining the sequence from C. esculenta rhizomes, the online expasy application was used to determine the PI. From the sequence, the PI was 8.59 due to the use of a weak anion exchange resin, DEAE-FF. Therefore, the anion resin should be increased by 1 pH unit above the PI of the compound. The PI of 8.59 needs to be adjusted by 1 pH unit to 9.59 because when the pH exceeds the PI, the protein acquires a negative charge and binds to the anion exchange [20].
3.3. Analysis using SDS-PAGE
SDS-PAGE analysis was conducted on the highest peak obtained from the purification of sample C1 using Ion Exchange Chromatography [Table 1].
Table 1: SDS-PAGE analysis of purified sample C1 (supernatant with PBS) at pH 8.3; pH 7.2; and 9.6.
| Molecular weight (kDa) | pH 7.2 | pH 8.3 | pH 9.6 | |||
|---|---|---|---|---|---|---|
| Ft | F7–F15 | Ft | F1–F5 | Ft | F4–F10 | |
| 12.5 | √ | - | √ | - | √ | √ |
| 20 | - | - | - | - | - | - |
| 60 | √ | √ | √ | √ | - | - |
Ft: Flow-through, F: Fraction, √: Band detected, - : Band no detected, SDS: Sodium dodecyl sulfate, PBS: Phosphate buffer saline
In the flow-through (Ft) results at pH 7.2 and pH 8.3, there were two bands at ~12.5 and 60 kDa. Fraction test results at pH 7.2 fractions 7–15 showed a single band of ~60 kDa, and at pH 8.3 fractions 1–5 detected protein ~60 kDa. Meanwhile, the results at pH 9.6, Ft exhibited a single band of ~12.5 kDa as well as in fractions 4–10 had a single band at ~12.5 kDa, so this fraction was further analyzed.
3.4. Determination of Lectin Protein Content at pH 9.6 using the BCA Method
Protein content determination was carried out on the purified samples obtained from fractions 4–10 at pH 9.6. Table 2 shows the determination of protein content using the BCA method with an absorbance of 562 nm. The BCA test was conducted to ascertain the lectin concentration in the purification results. Furthermore, the concentration ranged from 1284.83 to 2947.33 μg mL-1, with the highest observed in the flow-through. The BCA test is a widely used procedure for determining protein concentration due to its simplicity, sensitivity, repeatability, and reproducibility [19].
Table 2: Purified lectin protein concentration at pH 9.6.
| Sample | Lectin protein concentration (µg μL−1) |
|---|---|
| Flow through | 2947.33 |
| 4th fraction | 1550.94 |
| 5th fraction | 1561.5 |
| 6th fraction | 1482.61 |
| 7th fraction | 1486.5 |
| 8th fraction | 1423.16 |
| 9th fraction | 1398.72 |
| 10th fraction | 1284.83 |
3.5. Hemagglutination
In this test, a sample concentration gradient from 4 to 1 μg mL-1 of the purified fraction at pH 9.6 was used. Table 3 shows the results of the hemagglutination test and it was compared with that of the SDS-PAGE analysis.
Table 3: Illustration of pH 9.6 purification hemagglutination test results.
| Fractions | 1 (control) | 2 (4 µg mL−1) | 3 (3 µg mL−1) | 4 (2 µg mL−1) | 5 (1 µg mL−1) |
|---|---|---|---|---|---|
| A (flow through) | - | + | − | + | − |
| B (fraction-4) | + | + | + | + | |
| C (fraction-5) | + | + | + | + | |
| D (fractions-6) | + | + | + | + | |
| E (fraction-7) | + | + | + | + | |
| F (fraction-8) | + | + | + | + | |
| G (fraction-9) | + | + | + | + | |
| H (fraction-10) | + | + | + | + |
(+): There was lectin protein activity, and (−): No lectin protein was identified
The hemagglutination test was performed on the fractionation results at pH 9.6, which showed the most optimal outcome with the presence of a tarin compound. Therefore, SDS-PAGE analysis and determination of protein concentration were performed on the resulting fraction. The hemagglutination test was conducted using three different concentrations, to identify the presence of lectin protein [23]. Lectin agglutinates red blood cells through non-covalent interactions with carbohydrates on the cell surface [24]. The hemagglutination results for pH 9.6 purification showed that fractions 4–10 had a positive result, indicating the presence of lectin protein. However, the flow-through sample at concentrations 3 and 1 μg mL-1 showed a negative result with sediment formation in the wells. Agglutination was affected by temperature and pH, where increasing the temperature of lectins derived from Momordica charantina plants to 55°C decreases the agglutination ability by 50%. The optimal pH range for lectins in plants is 5-8, and increasing the pH to 10–11 causes a 50% reduction in the agglutination ability [23]. Furthermore, the new lectin from loach skin mucus showed maximum agglutination at pH 7–8.5 and temperature between 20 and 50°C, while the lowest agglutination occurred at pH <6 and temperatures >50°C [25]. In this study, agglutination was observed between lectin extracted from C. esculenta rhizomes and rabbit erythrocytes due to the presence of carbohydrates on the surface of the cell.
4. CONCLUSION
In conclusion, the isolation and purification procedure of lectin from C. esculenta had the best conditions with extraction using PBS solvent and purification using ion exchange chromatography at pH 9.6. The results of SDS-PAGE of lectin isolates showed a molecular weight of 12.5 kDa which complies with tarin compounds. It is expected that the outcome of this research can be useful in the isolation of lectin from C. esculenta rhizome so that it can be applicable in larger-scale production.
5. ACKNOWLEDGMENT
This research was supported by the 2022 Matching Fund (MF) grant from the Ministry of Education, Culture, Research and Technology (Kemdikbudristek) of the Republic of Indonesia No. PKS:243/E1/KS06.02/2022.
6. AUTHORS’ CONTRIBUTIONS
All authors made substantial contributions to conception and design, acquisition of data, or analysis and interpretation of data; took part in drafting the article or revising it critically for important intellectual content; agreed to submit to the current journal; gave final approval of the version to be published; and agreed to be accountable for all aspects of the work. All the authors are eligible to be an author as per the International Committee of Medical Journal Editors (ICMJE) requirements/guidelines.
7. CONFLICTS OF INTEREST
The authors report no financial or any other conflicts of interest in this work.
8. ETHICAL APPROVALS
This study does not involve experiments on animals or human subjects.
9. DATA AVAILABILITY
All data generated and analyzed are included in this manuscript.
10. PUBLISHER’S NOTE
This journal remains neutral with regard to jurisdictional claims in published institutional affiliation.
REFERENCES
1. Konozy EH, Osman ME. Plant lectin:A promising future anti-tumor drug. Biochimie 20222;202:136-45. [CrossRef]
2. Nareddy PK, Bobbili KB, Swamy MJ. Purification, physico-chemical characterization and thermodynamics of chitooligosaccharide binding to cucumber (Cucumis sativus) phloem lectin. Int J Biol Macromol 2017;95:910-9. [CrossRef]
3. Das A, Roy A, Hess D, Das S. Characterization of a highly potent insecticidal lectin from colocasia esculenta tuber and cloning of its coding sequence. Am J Plant Sci 2013;4:408-16. [CrossRef]
4. Mitharwal S, Kumar A, Chauhan K, Taneja NK. Nutritional, phytochemical composition and potential health benefits of taro (Colocasia esculenta L.) leaves:A review. Food Chem 2022;383:132406. [CrossRef]
5. Moon SH, Shin SJ, Tae HJ, Oh SH, Bae JM. Effects of Colocasia antiquorum var. Esculenta extract in vitro and in vivo against periodontal disease. Medicina (Kaunas) 2021;57:1054. [CrossRef]
6. Pereira PR, De Aquino Mattos ÉB, Corrêa AC, Vericimo MA, Paschoalin VM. Anticancer and immunomodulatory benefits of taro (colocasia esculenta) corms, an underexploited tuber crop. Int J Mol Sci 2020;22:265. [CrossRef]
7. Gupta RK, Guha P, Srivastav PP. Effect of high voltage dielectric barrier discharge (DBD) atmospheric cold plasma treatment on physicochemical and functional properties of taro (Colocasia esculenta) starch. Int J Biol Macromol 2023;253:126772. [CrossRef]
8. Gupta RK, Guha P, Srivastav PP. Natural polymers in bio-degradable/edible film:A review on environmental concerns, cold plasma technology and nanotechnology application on food packaging-a recent trends. Food Chem Adv 2022;1:100135. [CrossRef]
9. Sandhiutami NM, Atayoglu AT, Sumiyati Y, Desmiaty Y, Hidayat RA, Atayoglu AT. The combination of Colocasia esculenta L. and Zingiber officinale potentially inhibits inflammation and pain. J Ilmu Kefarmasian Indones 2023;21:81. [CrossRef]
10. Pereira PR, Meagher JL, Winter HC, Goldstein IJ, Paschoalin VM, Silva JT, et al. High-resolution crystal structures of Colocasia esculenta tarin lectin. Glycobiology 2017;27:50-6. [CrossRef]
11. Pereira PR, Winter HC, Verícimo MA, Meagher JL, Stuckey JA, Goldstein IJ, et al. Structural analysis and binding properties of isoforms of tarin, the GNA-related lectin from Colocasia esculenta. Biochim Biophys Acta 2015;1854:20-30. [CrossRef]
12. Nascimento KS, Cunha AI, Nascimento KS, Cavada BS, Azevedo AM, Aires-barros MR. An overview of lectins purification strategies. J Mol Recognit 2012;25:527-41. [CrossRef]
13. Da Silva RC, Teixeira CS, Pretto A, Costa TS, De Siqueira JC, Pantoja BT, et al. Antinutritional effect of lectin from faveira (Parkia platycephala) seeds in tambatinga (Colossoma macropomum x Piaractus brachypomus). Bol Inst Pesca 2022;48:1-10. [CrossRef]
14. Jebor MA, Jalil YH. Extraction, purification and characterization of a lectin from white kidney bean. Med J Babylon 2012;9:11.
15. Thakur K, Kaur M, Kaur S, Kaur A, Kamboj SS, Singh J. Purification of Colocasia esculenta lectin and determination of its anti-insect potential towards Bactrocera cucurbitae. J Environ Biol 2013;34:31-6.
16. Roy S, Kumar V. A practical approach on SDS PAGE for separation of protein. Int J Sci Res 2014;3:955-60.
17. Jiang B, Wang X, Wang L, Lv X, Li D, Liu C, et al. Two-step isolation, purification, and characterization of Lectin from zihua snap bean (Phaseolus vulgaris) seeds. Polymers (Basel) 2019;11:785. [CrossRef]
18. Jawade AA, Pingle SK, Tumane RG, Sharma AS, Ramteke AS, Jain RK. Isolation and characterization of lectin from the leaves of Euphorbia tithymaloides (L.). Trop Plant Res 2016;3:634-41. [CrossRef]
19. Cortés-Ríos J, Zárate AM, Figueroa JD, Medina J, Fuentes-Lemus E, Rodríguez-Fernández M, et al. Protein quantification by bicinchoninic acid (BCA) assay follows complex kinetics and can be performed at short incubation times. Anal Biochem 2020;608:113904. [CrossRef]
20. Monks K, Krop U. Separation of Proteins with Anion Exchange Chromatography on Sepapure Q and DEAE. Santa Monica CA:Science Together.
21. Roy UK, Lavignac N, Rahman AM, Nielsen BV. Purification of lectin and Kunitz trypsin inhibitor from soya seeds. J Chromatogr Sci 2018;56:436-42. [CrossRef]
22. Sharma A, Ng TB, Wong JH, Lin P. Purification and characterization of a lectin from Phaseolus vulgaris cv. (Anasazi beans). J Biomed Biotechnol 2009;2009:929568. [CrossRef]
23. Da Silva JF, Lima CM, Da Silva DL, Do Nascimento LS. Lectin purification through affinity chromatography exploiting macroporous monolithic adsorbents. Separations 2023;10:36. [CrossRef]
24. Kumaran S, Pandurangan AK, Shenbhagaraman R, Esa NM. Isolation and characterization of lectin from the artist's conk medicinal mushroom, Ganoderma applanatum (Agaricomycetes), and evaluation of its antiproliferative activity in HT-29 colon cancer cells. Int J Med Mushrooms 2017;19:675-84. [CrossRef]
25. Sun PP, Ren YY, Zheng J, Hu AJ. Purification and characterization of a new lectin from loach skin Mucus. J Chem 2019;2019:1-11. [CrossRef]