
1. INTRODUCTION
The medicinally important health beverage consumed worldwide as tea, belongs to the genus Camellia under the Theaceae family. The world-famous tea originated in China with five reported subspecies and two varieties among which Camellia sinensis L.O Kuntze is mostly cultivated worldwide to make the famous tea [1]. The predominant tea varieties cultivated worldwide are the China variety with small leaves (Camellia sinensis L.), large leaf Assam variety (Camellia sinensis var. assamica), and intermediate leaf Cambod varieties (Camellia assamica var. lasiocalyx) [2].
Apart from its medicinal importance, tea is one of the most important cash crops of India. The world-famous Darjeeling tea serves its purpose for the Indian economy due to its unique flavor and aroma. Darjeeling tea gardens have established several elite tea clones. Environmental influences and plant age make it harder to study genetic diversity based on morphological traits unlike the molecular traits [1].
A previous study on Darjeeling tea clones reports the study of genetic diversity using a robust technique such as the RAPD, ISSR, and AFLP markers [3-5]. However, no study has been reported in the genetic diversity of Darjeeling tea clones using matK primers.
DNA barcoding, a concise method for taxonomic identification, uses a standard short sequence with ample variation to differentiate among species. Many regions from the plastid genome such as the rbcL, rpoC1, rpoB, and trnH-psbA intergenic spacer apart from the matK region have been suggested and exploited for DNA barcoding of land plants [6,7]. However, the Consortium for the Barcode of Life (CboL) has recommended rbcL and matK as standard DNA barcode for plants because of its increased variation between species and the important role it plays in the phylogenetic restoration of terrestrial plants [8,9]. The matK gene around 1500 base pairs (bp) also known as orfK is utilized in the study of molecular systematics and evolution since the matK gene contains high substitution rates within species [10]. The matK gene, coding maturase protein, is responsible for splicing of Group II intron. It is located within the intron of the trnK gene whose two flanking exons were lost, thus leaving the gene intact for splicing [11]. Due to its high degree of substitution and variation than other genes, the matK gene is considered to evolve quickly [12]. The matK gene has ideal size and also a mutational conserved region along with a greater rate of substitution and low transition/transversion ratio. The sequence varies at the nucleic acid level at first and second codon positions. All of these features of matK have a profound impact on relationship study at family and species level [11].
Based on previous reports, we found that the Indian tea clones have no report on barcode analysis. Thus, the main objective of the work is to study the genetic diversity and variation within the chloroplast region of the tea clones grown in Darjeeling and Dooars. We collected 33 elite tea clones from the Darjeeling region, which is famous worldwide for tea. We have chosen matK, one of the standard DNA barcodes recommended for plants and also because of the fact of the matK gene having high substitution rates within species, which makes it ideal for our study. Therefore, we aim to perform barcode analysis of collected tea clones by fulfilling steps such as genomic DNA isolation, DNA purification, and quantification, PCR amplification of the matK region, sequencing of the amplified fragments, and sequence analysis using different tools of bioinformatics. This work highlights the importance of the utilization of a single-locus matK region to study intraspecific variation and also infers the evolution of the matK gene within the same species of Camellia.
2. MATERIALS AND METHODS
2.1. Sample Selection and Collection
A total of 33 tea clones were collected for this study [Table 1]. The samples were collected from Darjeeling hills.
Table 1: List of tea clones chosen for study.
| SI. No | Clone | Abbreviation/Alternative name |
|---|---|---|
| 1 | Ambari Vallai 2 | AV2 |
| 2 | Phoobsering 312 | P312 |
| 3 | Happy valley 39 | HV39 |
| 4 | Tukdah 253 | T-253 |
| 5 | Nanda Devi | TS 378 |
| 6 | Makaibari-6 | MB-6 |
| 7 | Teesta Valley 1 | TTV-1 |
| 8 | Tukdah 383 | T-383 |
| 9 | Kopati 1/1 | K1/1 |
| 10 | B-15/263 | Badamtam -15/263 |
| 11 | Balasun 7/1A/76 | BS 7/1A/76 |
| 12 | Bunnockburn 777 | B-777 |
| 13 | Sundaram | B/5/63 |
| 14 | Tukdah-135 | T-135 |
| 15 | Tocklai seed 378 | TS 378 or Nanda Devi |
| 16 | Bunnockburn 688 | B-688 |
| 17 | Golconda | B/6/36 |
| 18 | Rungli Rungiliot 17/144 | RR-17/144 |
| 19 | Balasun 9/3/76 | BS-9/3/76 |
| 20 | Chiradew Parbat1 | CP-1 |
| 21 | Phoobsering 1404 | P-1404 |
| 22 | Phoobsering 1258 | P-1258 |
| 23 | Rungli Rungiliot 4/5 | RR-4/5 |
| 24 | Sikkim 1 | SKM-1 |
| 25 | Thurbo 3 | Thurbo-3 |
| 26 | Thurbo 9 | Thurbo-9 |
| 27 | Tukdah 145 | T-145 |
| 28 | Tukdah 246 | T-246 |
| 29 | Tocklai variety 19 | TV-19 |
| 30 | Tocklai variety 14 | TV-14 |
| 31 | Tukdah 78 | T-78 |
| 32 | Bannockburn 157 | B-157 |
| 33 | B/5/63 | Sundaram |
2.2. DNA Barcoding
2.2.1. DNA Isolation
DNA was isolated from a 5 g fresh leaf sample of tea clones (Camellia sinensis) using the CTAB extraction method with slight modification [13]. For the CTAB DNA extraction method, 5 g of fresh and tender leaves of Camellia was taken and pulverized using a mortar and pestle using liquid nitrogen. The pulverized material was quickly transferred and mixed into an Oakridge tube containing pre-warmed CTAB extraction buffer. It was then incubated for 1 h at 65°C with occasional mixing in-between. An equal volume of chloroform and isoamyl alcohol (24:1) was added and gently mixed. It was then centrifuged at 6000 rpm for 10 min at room temperature. An equal volume of ice-cold isopropanol was added to the supernatant and mixed by inversion. Following incubation for 2 h at −20°C, the mixture was centrifuged at 6500 rpm for 30 min at 4°C. The supernatant was discarded and the pellet was washed thoroughly with 70% ice-cold ethyl alcohol and allowed to dry for about an hour. The pellet was dissolved in 500 ml of 1X TE buffer and to it, and an equal volume of equilibrated phenol was added and mixed properly followed by centrifugation at 13,000 rpm for 20 min. The upper aqueous layer was transferred into a fresh tube followed by the addition of an equal volume of chloroform:isoamyl alcohol (24:1) and centrifuged at 10,000 rpm for 15 min at room temperature. The supernatant was again transferred to a new tube and treated with 1/10th volume of 3 M sodium acetate and double volume of ice-cold absolute ethyl alcohol. It was mixed gently and then centrifuged at 13,000 rpm for 30 min at 4°C. The supernatant was discarded and the pellet was washed using 70% ethanol, air-dried, and finally dissolved in 500 ml of 1X TE buffer.
2.2.2. DNA purification
RNA, protein, and polysaccharides being the main contaminants in crude DNA, hamper the isolation process and it is, therefore, very important to remove such impurities. CTAB was used to eliminate polysaccharides from DNA along with subsequent use of phenol:chloroform and RNase to further eliminate proteins and RNA to a large extent from crude DNA.
For the purification process, freshly prepared RNaseA was added into the buffered solution of DNA and incubated at 37°C for 1 h in a dry bath. An equal volume of chloroform:isoamyl alcohol (24:1) was added and mixed properly and centrifuged at 10,000 rpm for 15 min at room temperature. The supernatant was transferred to another tube and 1/10th volume of 3 M sodium acetate and double volume of ice-cold absolute ethyl alcohol was added followed by centrifugation at 13,000 rpm for 30 min at 4°C. Finally, the DNA pellet was washed using ice-cold 70% ethyl alcohol and air-dried and finally dissolved in 100 ml of 1X TE buffer.
2.2.3. DNA quantification
The isolated DNA was quantified using a UV spectrophotometer (Agilent Technologies Cary 60 UV–Vis) at 260 and 280 nm filters. The samples providing the ratio of absorbance at 260 nm to absorbance at 280 nm equivalent to 1.8 was only considered of good quality.
2.2.4. PCR amplification and sequencing of the matK region
The matK region was amplified in a 25 μl reaction volume comprising of 12.5 μl of GoTaq PCR master mix, 1.25 μl of matK-F and matK-R, 2 μl of DNA, and 8 μl of pyrogen-free water. The working concentrations taken for primers were 1.236 μM (matK-F) and 0.958 μM (matK-R), respectively. The details of the primers are given in Table 2. The PCR reactions were performed on a thermocycler (Applied Biosystems Veritti 96-well Thermal Cycle) using the following conditions: Denaturation of template DNA at 94°C for 4 min followed by 35 cycles of reactions: 94°C for 1 min, primer annealing at 48°C for 30 s, and primer extension at 72°C for 1 min with the final extension cycle at 72°C for 7 min. The success of the PCR was verified by agarose gel electrophoresis. The PCR product (5 ml) was run in an agarose gel (1%) and visualized under UV transilluminator. DNA sequencing was done using (ABI 3730 XL) from Bioserve Biotechnologies Pvt. Ltd.
Table 2: Details of matK primer.
| Primer used | Tm of primer | Annealing temperature | Conc. of primer (pm/μl) | Length of primer with sequence |
|---|---|---|---|---|
| matK forward (F) | 46 | 48°C | 161.83 | 22 (CGATCTATTCATTCAATATTTC) |
| matK reverse (R) | 53 | 48°C | 208.38 | 22(TCTAGCACACGAAAGTCGAAGT) |
2.2.5. Sequence submission
The obtained sequences were edited as per the NCBI guidelines (www.ncbi.nlm.nih.gov) and further compared by querying against existing global sequences in the GenBank database (
Table 3: Accession number and details of the submitted matK sequence retrieved from NCBI.
| Full name | Abbreviation | NCBI accession | Unique Id | Base pairs |
|---|---|---|---|---|
| Ambari Vallai 2 | AV2 | MH649284 | 1111 | 757 bp |
| Phoobsering 312 | P312 | MK393394 | 1112 | 871 bp |
| Happy valley 39 | HV39 | MH791417 | 1113 | 864 bp |
| Tukdah 253 | T-253 | MH920315 | 1114 | 876 bp |
| Nanda Devi | TS 378 | MH920316 | 1115 | 816 bp |
| Makaibari-6 | MB-6 | MH920317 | 1116 | 758 bp |
| Teesta Valley 1 | TTV-1 | MH920318 | 1117 | 861 bp |
| Kopati 1/1 | K1/1 | MH920319 | 1119 | 774 bp |
| Balasun 7/1A/76 | BS 7/1A/76 | MK393393 | 11111 | 833 bp |
| Bunnockburn 777 | B-777 | MK393395 | 11112 | 757 bp |
| Sundaram | B/5/63 | MK393396 | 11113 | 644 bp |
| Tukdah-135 | T-135 | MK393397 | 11114 | 763 bp |
| Bunnockburn 688 | B-688 | MK393398 | 11116 | 833 bp |
| Golconda | B/6/36 | MK393399 | 11117 | 644 bp |
| Rungli Rungiliot 17/144 | RR-17/144 | MK393400 | 11118 | 826 bp |
| Balasun 9/3/76 | BS-9/3/76 | MK393401 | 11119 | 756 bp |
| Chiradew Parbat1 | CP-1 | MK393402 | 11120 | 761 bp |
| Phoobsering 1404 | P-1404 | MK393403 | 11121 | 763 bp |
| Phoobsering 1258 | P-1258 | MK393404 | 11122 | 751 bp |
| Rungli Rungiliot 4/5 | RR-4/5 | MK393405 | 11123 | 746 bp |
| Sikkim 1 | SKM-1 | MK424865 | 11124 | 867 bp |
| Thurbo 3 | Thurbo-3 | MN480321 | 11125 | 761 bp |
| Thurbo 9 | Thurbo-9 | MN480322 | 11126 | 707 bp |
| Tukdah 145 | T-145 | MK424866 | 11127 | 761 bp |
| Tukdah 246 | T-246 | MK424867 | 11128 | 756 bp |
| Tocklai variety 19 | TV-19 | MK424868 | 11129 | 750 bp |
| Tocklai variety 14 | TV-14 | MK424869 | 11130 | 735 bp |
| Tukdah 78 | T-78 | MK424870 | 11131 | 755 bp |
| Bannockburn 157 | B-157 | MK424871 | 11132 | 735 bp |
2.3. Sequence Analysis
Complete 29 experimental sequences of Camellia sinensis clones were taken for final sequence analysis. A total of four sequences were excluded from the final dataset based on its short size (<600 base pairs) or sequencing error. The barcode sequences of the matK region of tea clones were further analyzed using MEGA X (Molecular Evolutionary Genetics Analysis) software (
The DNA sequences were first aligned (pairwise alignment and multiple sequence alignment) using ClustalW and an evolutionary history was inferred using clustering methods such as neighbor-joining [14] and Unweighted Pair Group Mean Average method [15] with arithmetic mean (UPGMA) of MEGA X [16]. The bootstrap value was set to 1000 replicates. The phylogenetic tree drawn to scale was inferred with branch lengths in the same units as evolutionary distances. The evolutionary distances were computed using the Kimura 2- parameter method [17] with the units given as the number of base substitutions per site. The first, second, and third codon positions were included. Small sequences were not considered for analysis as well as all positions containing gaps and missing data were eliminated from the dataset. There were a total of 563 positions in the final dataset.
Further genetic pairwise distance for matK was calculated using the Kimura 2-parameter model [17] and maximum composite likelihood model [18] as given in MEGA X. Sequences were further aligned using Multalin V.5.4.1 (
3. RESULTS
3.1. matK Amplification and Sequencing
The primer used for analysis showed successful amplification of matK [Figure 1] in all the studied clones. The size of the amplified PCR products was approximately within the range of 900 bp–1000 bp. However, the final sequencing result provided matK sequences of size ranging from 644 bp to 876 bp. The accession number for the submitted sequences and the details is provided in Table 3.
.png) | Figure 1: Amplification of the matK region. Lane L1: 100 bp ladder; lane 1–33: 33 tea clones. [Click here to view] |
3.2. Blast Result
Blast analysis revealed 24 clones out of 29 to be 100% identical with Camellia sinensis. The percentage of similarity with Camellia sinensis recorded for other clones was 99.29% (Thurbo 9), 99.61% (Thurbo 3), 99.64% (RR-4/5), 99.88% (SKM-1), and 99.89% (P312). Despite showing 99.61% (Thurbo 3) and 99.29% (Thurbo 9) similarity with Camellia sinensis, both the clones showed a higher percentage of similarity with other species of Camellia, that is, Thurbo 3 showed 99.87% and Thurbo 9 showed 99.57% similarity with Camellia mairei (KJ197933.1). Thus, a percentage similarity value below 99.64% placed the clones under different species of Camellia.
3.3. Sequence Alignment and Phylogenetic Tree Construction
Both neighbor-joining [Online Resource 1(SM1)] and UPGMA [Figure 2] tree revealed variation among the sequences. All the combined nucleotide sequences clustered together with exceptions such as Thurbo 3 (11125), Thurbo 9 (11126) clustering together, and P312 (1112) and RR-17/144 (11118) differing from the main group. To validate our results, we also constructed a phylogenetic tree adding a sequence of different Camellia species (KJ197933.1) taken from the NCBI database. Thurbo 3 (11125) and Thurbo 9 (11126) now clustered with the reference sequence of Camellia mairei (KJ197933.1) as depicted by the neighbor- joining [Figure 3] and UPGMA tree [Online Resource 2(SM1)]).
.png) | Figure 2: UPGMA tree method showing the genetic relationship of matK region between 29 tea clones. [Click here to view] |
.png) | Figure 3: Neighbor-joining tree method showing the genetic relationship of matK region between 29 tea clones along with sequence of Camellia mairei (KJ197933.1) taken from NCBI. [Click here to view] |
3.4. Sequence Analysis
The genetic distances for the matK sequence ranged from 0 to 0.0090 (Nucleotide: Maximum composite likelihood method) given in Figure 4 and from 0 to 0.0089 (Nucleotide: Kimura 2-parameter method) given as Online Resource 3 (SM1). The overall mean distance was recorded as 0.0013. The results show the number of base substitutions per site and are based on an analysis of a total of 29 sequences (all codon positions included) with a total of 563 positions in the final dataset excluding the eliminated positions containing gaps and missing data.
 | Figure 4: Genetic distances of the matK sequence calculated using nucleotide: maximum composite likelihood method. [Click here to view] |
The matK sequence showed two unique variable sites in Thurbo 3, Thurbo 9, and Camellia mairei that differed from the rest of the sequences. This was validated by a high consensus sequence of 563 bp prepared using Multalin software. A total of nine substitutions were observed in high consensus region where Thurbo 3 (11125) showed a total of three variable sites, Thurbo 9 (11126) showed a total of four variable sites and some single variable site was seen in P312 (1112) and RR-17/144 (11118), as shown in Figure 5 and Online Resource 4a (SM2). Study of low consensus region also revealed a total of five nucleotide substitution or variation with SKM-1 (11124) showing three variable sites, and Thurbo 9 (11126) and P1258 (11122) sowing one variable site each [Online Resource 4b (SM2)].
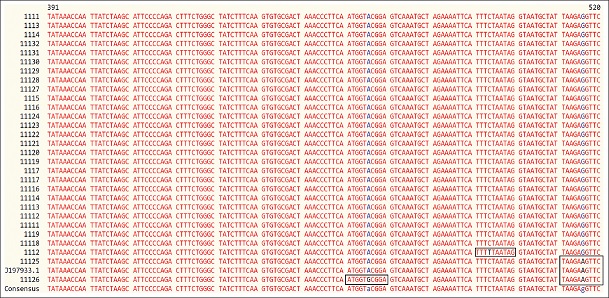 | Figure 5: Consensus region of the aligned sequences showing nucleotide substitution as highlighted by black box. [Click here to view] |
The sequences are represented illustratively as barcode and QR code [Figure 6 and Online Resource 5 (SM3)]. The QR code generated can be decoded as DNA sequences that make data storage and retrieval comparatively easy.
 | Figure 6: matK sequences represented illustratively as barcode and QR code. [Click here to view] |
4. DISCUSSION
With the advancement of technology, sequencing analysis has uplifted the research in the molecular field, and thus, a small difference or rather variation (intraspecific or interspecific) can be studied which could not be accomplished easily using morphological means or other robust molecular techniques.
DNA barcoding is used for species identification and it utilizes many plastid and nuclear regions. A total of the seven-plastid region were explored in land plants and the combination of rbcL+matK was considered as the best combination for plant barcode [21]. Some other scientific studies reported the successful use of a combination of matK+ITS and rbcL+trnH-psbA to study 100% differences between Cassia species [22]. However, the efficiency of only a single matK region to differentiate Vachellia species from other Acacia species was reported earlier with concluding remarks about the possibility of utilizing matK for separating taxa at the genus level [23].
Some previous reports have suggested successful amplification and use of the matK region to investigate phylogeny in both monocots and dicots such as Zingiberaceae [11], Erythronium [24], Myristica fragrans [25], local tomato [26], and oil-bearing roses [27].
The barcode technique is also used nowadays to detect any kind of contaminants. Researchers have reported the presence of adulterant with counter indications for pregnant women in bamboo tea products and also detected the origin of bamboo leaves that were used in the product [28]. Researchers have also used DNA barcodes (rbcL, matK, ITS2, and psbA-trnH) to distinguish between the commercial non-Camellia tea and the adulterants present in it, to assess their safety, although a limited number of original plant sequences in GenBank limited the findings [29]. There are reports of matK locus placing two genera Myristica and Knena differently at a sequence similarity of 99.43% while genus Virola differed with 99.25% [25]. The tomatoes were placed within the same species even with 99.64% similarity, thus limiting the assumption of percentage identity required as 99.74–100% to place organisms within the same species [30]. Whereas our study has differentiated two species at percentage identity below 99.64% with clones such as 11125 (Thurbo 3) and 11126 (Thurbo 9) showing 99.61% and 99.29% identity with Camellia sinensis when compared, respectively, to 99.87% and 99.57% identity with Camellia mairei.
Two species T. cope and T. wightii [31] did not differ at rbcl locus but showed a difference in matK (2 nucleotide difference) and trnH-psbA (1 nucleotide difference). This could broaden the interspecific variation if the two loci are considered as two-gene approach and thus they reported interspecific variation (p-distance 0.002–0.003) but no intraspecific variation (p-distance 0.00). Another work reported having three variable sites in trnH-psbA sequences among seven tomato varieties with genetic distance ranging from 0 to 0.004 [26]. On the contrary, rbcL, rpoC1, and rpoB sequences did not show any variable sites, thus suggesting it to be 100% conserved within the species. The matK locus failed to differentiate Myristica at species level since the blast results showed 100% similarity with other three species of Myristica and also reported three nucleotide differences with Rivola sebifera and four nucleotide difference with Knema laurina, thus concluding the ability of matK locus to differentiate only at the genus level within the family of Myristicaceae. However, in our study, we report a total of nine variable sites in the high consensus region and a total of five variable sites in the low consensus region of matK sequences within the same species of Camellia sinensis. Therefore, we report intraspecific variation and conclude with a fact of matK sequence not being 100% conserved within the same species of Camellia.
5. CONCLUSION
This work reports the successful use of the matK region to explore the genetic diversity and variation within the matK gene of chloroplast region among the elite clones of Darjeeling and Dooars. The employment of the matK region with its known increased rate of substitution, low transition/transversion ratio, and quick evolving rate aided to study the intraspecific variation due to probable contamination from other tea plants. The evolution of the matK region within the same species of Camellia sinensis was evident from our results where we report variable sites within the consensus region and conclude with the fact of the matK gene not being 100% conserved among Camellia sinensis. The DNA barcode of elite tea clones of Darjeeling and Dooars was thus established, wherein we conclude with the remark of matK being a good candidate for DNA barcoding of Camellia sinensis as well as for rapid detection of variation and molecular evidence of clones at a minimal cost, thus avoiding other robust molecular techniques.
6. ACKNOWLEDGMENTS
Reha Labar is thankful to the University Grants Commission (UGC-RGNF-SC) for providing the fellowship. We also acknowledge the prompt service provided by the National Centre of Biotechnology Information and Bioserve Sequencing Services.
7. FUNDING
University Grants Commission (UGC-RGNF-SC).
8. AUTHOR CONTRIBUTIONS
All authors made substantial contributions to conception and design, acquisition of data, or analysis and interpretation of data; took part in drafting the article or revising it critically for important intellectual content; agreed to submit to the current journal; gave final approval of the version to be published; and agree to be accountable for all aspects of the work.
9. CONFLICTS OF INTEREST
The authors report no conflicts of interest in this work.
10. ETHICAL APPROVALS
This study does not involve the use of animals or human subjects.
REFERENCES
1. Lee SC, Wang CH, Yen CE, Chang C. DNA barcode and identification of the varieties and provenances of Taiwan's domestic and imported made teas using ribosomal internal transcribed spacer 2 sequences. J Food Drug Anal 2017;25:260-74. [CrossRef]
2. Sharma RK, Bhardwaj P, Negi R, Mohapatra T, Ahuja PS. Identification, characterization and utilization of unigene derived microsatellite markers in tea (
3. Baruah AR, Hemanta S, Biswajit B. Detection of close genetic relatedness in some tea genotypes of Assam and Darjeeling using RAPD markers. J Plant Crops 2010;38:11-5.
4. Mishra RK, Sen-Mandi S. Genetic diversity estimates for Darjeeling tea clones based on amplified fragment length polymorphism markers. J Tea Sci 2004;24:86-92.
5. Roy SC, Chakraborty BN. Genetic diversity and relationships among tea (
6. Kress WJ, Erickson DL. A two-locus global DNA barcode for land plants:The coding rbcL gene complements the non-coding trnH-psbA spacer region. PLoS One 2007;2:e508. [CrossRef]
7. Singh HK, Parveen I, Raghuvanshi S, Babbar SB. The loci recommended as universal barcodes for plants on the basis of floristic studies may not work with congeneric species as exemplified by DNA barcoding of
8. Bafeel SO, Arif IA, Bakir MA, Khan HA, Al Farhan AH, Al Homaidan AA,
9. Kuzmina ML, Johnson KL, Barron HR, Hebert PD. Identification of the vascular plants of Churchill, Manitoba, using a DNA barcode library. BMC Ecol 2012;12:1-11. [CrossRef]
10. Hilu KW, Liang G. The matK gene:Sequence variation and application in plant systematics. Am J Bot 1997;84:830-9. [CrossRef]
11. Selvaraj D, Sarma RK, Sathishkumar R. Phylogenetic analysis of chloroplast matK gene from
12. Barthet MM. Expression and Function of the Chloroplast-encoded Gene matK, Doctoral Dissertation. Virginia:Virginia Polytechnic Institute and State University;2006.
13. Doyle JJ, Doyle JL. A rapid DNA isolation procedure for small quantities of fresh leaf tissue. Phytochem Bull 1987;19:11–15
14. Saitou N, Nei M. The neighbor-joining method:A new method for reconstructing phylogenetic trees. Mol Biol Evol 1987;4:406-25.
15. Sneath PH. Numerical Taxonomy:The Principles and Practice of Numerical Classification. United States:W.H. Freeman &Co Ltd.;1973. 573.
16. Kumar S, Stecher G, Li M, Knyaz C, Tamura K. MEGA X:Molecular evolutionary genetics analysis across computing platforms. Mol Biol Evol 2018;35:1547-9. [CrossRef]
17. Kimura M. A simple method for estimating evolutionary rates of base substitutions through comparative studies of nucleotide sequences. J Mol Evol 1980;16:111-20. [CrossRef]
18. Tamura K, Nei M, Kumar S. Prospects for inferring very large phylogenies by using the neighbor-joining method. Proc Natl Acad Sci 2004;101:11030-5. [CrossRef]
19. Corpet F. Multiple sequence alignment with hierarchical clustering. Nucleic Acids Res 1988;16:10881-90. [CrossRef]
20. More RP, Mane RC, Purohit HJ. MatK-QR classifier:Patterns based approach for plant species identification. BioData Mining 2016;9:39. [CrossRef]
21. Group CP, Hollingsworth PM, Forrest LL, Spouge JL, Hajibabaei M, Ratnasingham S,
22. Purushothaman N, Newmaster SG, Ragupathy S, Stalin N, Suresh D, Arunraj DR,
23. Steven GN, Subramanyam R. Testing plant barcoding in a sister species complex of pantropical
24. Allen GA, Soltis DE, Soltis PS. Phylogeny and biogeography of
25. Tallei TE, Kolondam BJ. DNA barcoding of Sangihe Nutmeg (
26. Caprar M, Copaci CM, Chende DM, Sicora O, Sumalan R, Sicora C. Evaluation of genetic diversity by DNA barcoding of local tomato populations from North-Western Romania. Not Bot Horti Agrob Cluj Napoca 2017;45:276-9. [CrossRef]
27. Wang H, Yao L, Cai R, Pan J, Chen X. Genetic relationship analyses of oil-bearing roses in China using matK sequences. Sci Horticult 2012;137:121-4. [CrossRef]
28. Horn T, Haser A. Bamboo tea:Reduction of taxonomic complexity and application of DNA diagnostics based on rbcL and matK sequence data. PeerJ 2016;4:e2781. [CrossRef]
29. Long P, Cui Z, Wang Y, Zhang C, Zhang N, Li M,
30. Lawodi EN. Variasi genetik tanaman tomat dari beberapa tempat di sulawesi utara berdasarkan gen matk. Pharmacon 2013;2:3098.
31. Ragupathy S, Newmaster SG, Murugesan M, Balasubramaniam V. DNA barcoding discriminates a new cryptic grass species revealed in an ethno botany study by the hill tribes of the Western Ghats in Southern India. Mol Ecol Resour 2009;9:164-71. [CrossRef]