
1. INTRODUCTION
Air pollutants comprising particulate matter (PM), vehicular exhaust, and industrial emissions cause adverse health effects in humans, disturb plant ecosystem, and impact globally by altering the atmosphere [1]. Foliar surface of plants acts as a sink for deposition of air pollutants in the urban and industrial environment. Plants that are tolerant to air pollutants and PM are explored as increasingly considered as an eco-sustainable tool for mitigation of air pollution [2]. Screening and identification of plants that are adaptive to the native environment of polluted sites provide ecological restoration strategies to mitigate the impact of air pollution.
Plants differ in their sensitivity to tolerate air pollution and Singh and Rao [3] proposed a formula computing four physicochemical (relative water content [RWC] and leaf extract pH) and biochemical (ascorbic acid and total chlorophyll content) parameters for screening and classifying plants according to their tolerant or sensitive to environmental pollution. Further, air pollution tolerance index (APTI) was applied to classify tree, shrubs, and herbs into sensitive and tolerant based on response of plants to air pollution under laboratory and field experiments [4]. Plants with APTI index of <11, 12–16, and >17 are considered as sensitive, intermediate tolerance, and tolerant to air pollution [4].
In the present study, physicochemical parameters such as pH of leaf extractives, RWC, and stomatal index were assessed in six plants commonly growing in polluted and the corresponding non-polluted (NP) control sites in Bengaluru city were determined to assess the impact of air pollution. Effect of air pollution on important determinants of plant growth such as chlorophyll and ascorbic acid content was evaluated. APTI was computed and correlated with all the parameters studied to identify important determinant correlating with the tolerance in the polluted and NP areas of Bengaluru.
2. MATERIALS AND METHODS
2.1. Plant Collection and Preparation of Extracts
Fresh leaves of the selected plants from the polluted sites near industries and NP (control sites) were collected. Aqueous extracts were prepared according to standard procedures.
2.2. Biochemical Parameters
2.2.1. pH
About 100 mg of fresh leaves were collected and dried and were homogenized in 10 ml of double distilled water and were filtered and pH of the filtrate containing the leaf extract was examined using calibrated pH meter (pH 4 and pH 9).
2.2.2. Relative water content
After collection, fresh leaf material was weighed and their initial weight was recorded. Overnight weight of the leaf samples immersed in the distilled water was also recorded after blotting it in dry sheet. Dry weight of the leaves was measured after incubating it in a hot air oven at 70°C and dried weight was reweighed. Relative water content was calculated using standard formula [5].
RWC=[(FW-DW)/(TW-DW)]×100.
Where,
FW indicates fresh weight,
DW indicates dry
TW indicates turgid weight.
2.2.3. Ascorbic acid content
Titrimetric method was used to analyze the ascorbic content of the sample using 2,6,-dichlorophenol indophenol dye [6]. 500 mg of collected leaf sample was extracted using 4% oxalic acid and the collected extract was then titrated against the dye. Appearance of pink color was considered as the indicator. Values were subtracted with blank.
2.2.4. Stomatal index
Collected fresh leaves were washed in distilled water and boiled in concentrated nitric acid for 2 min. Epidermis was peeled off from the treated samples and was stained with safranin and the mounted slide was observed in microscope (×10×40). Upper, middle, and lower region of leaf lamina was examined. Stomatal index was measured using stage and ocular scale. Stomatal index was calculated using the following formula:
Stomatal index=[S/(S+E)]×100
2.2.5. Total chlorophyll and carotenoids content
Total chlorophyll and carotenoids content was measured using Arnon’s method [7]. Freshly collected leaves (500 mg) were ground and extracted with 10 ml of 80% acetone for 15 min and were centrifuged at 2500 rpm for 3 min. The supernatant was collected and the absorbance was measured at 645 nm and 663 nm for chlorophyll a and b and 480 and 510 nm for carotenoids using spectrophotometer. Chlorophyll content was calculated using the formula:
- Total chlorophyll: Chlorophyll a+Chlorophyll b; CTc: 20.2 (D645)+8.02 (D 663)
- Total chlorophyll content: 0.1 CT×(leaf dry weight/leaf fresh weight),
- Carotenoids=7.6×480 OD–1.49×510 OD.
2.2.6. Calculation of APTI
The air pollution tolerance indices for the selected plants were determined using the following formula [3]:
APTI=(A [T+P]+R)/10.
Where,
A indicates ascorbic acid content (mg/gm),
T indicates total chlorophyll (mg/gm),
P indicates pH of the leaf extract,
R indicates relative water content of leaf (%).
2.3. Statistical Analysis
Statistical analysis was carried out using Microsoft Excel Office. Significance of variation in selected plants from polluted and NP areas was measured in independent trials using Student’s t-test.
3. RESULTS AND DISCUSSION
3.1. Relative Water Content
Relative water content of leaves from polluted and NP source is presented in Figure 1a. Mean RWC of plants from NP areas was 69.42 ± 8.22(%) which was significantly higher (P < 0.05) compared to plants from polluted area (61.28 ± 7.7%, Figure 1b). Effect on air pollution on water holding capacity of leaves varied with different plants. In Lantana camara collected from polluted area, there was maximum 20% reduction in RWC when compared to that of NP area (62.61% in polluted v/s 78.15% in NP). A moderate effect of air pollution assessed by 13–15% reduction in RWC was recorded in Ocimum sanctum, Bougainvillea spectabilis, and Leucas aspera. In Vinca rosea and Ricinus communis plants from polluted area showed lesser reduction in RWC of 3% (86.29 in polluted and 88.59 in NP) and 7% (53.88 in polluted v/s 58.22 in non-polluted areas), respectively, compared to that from NP area. Plants with higher RWC are having better air pollution, tolerance capacity was reported [8]. Similarly, in our study, V. rosea from non-polluted area with highest RWC of 88.59% showed highest APTI of 27.44 [Table 1]. Airborne pollutants are extensively reported to increase the loss of water and nutrients from plant leaves affected by increased protoplasmic permeability, leading to senescence [9]. Higher RWC helps plant in regulating the physiological functions under stress induced by airborne pollutants [10]. Higher water holding capacity of leaves under polluted environment may impart tolerance against the toxic airborne pollutants.
3.2. pH of Leaf Extractives:
The pH of leaf extractives of the leaves from polluted and NP areas is summarized in Figure 2a. The pH in plants from polluted and NP plants ranged from 6.54 to 7.6 and 6.14 to 7.34, respectively. There were significant (P < 0.05) variations observed in mean pH of plants from polluted and NP areas (6.84 ± 0.18 in polluted v/s 7.04 ± 0.15, Figure 2b). However, marked decrease in pH was observed in L. camara (−0.40 units) followed by L. aspera (−0.31). In O. sanctum and B. spectabilis, moderate decrease in pH of 0.26 and 0.2 units was recorded. In R. communis and V. rosea showed similar pH in plants collected from both polluted and NP areas. The presence of acidic pollutants such as SO2 and NO2 in air cause lowering of pH. Higher tolerance of plants with higher pH of leaf extractives against pollutants was reported [11]. Higher pH of leaf extractives provides optimal pH for synthesis or reducing activity of important antioxidants such as ascorbic acid, thereby protects enzymes involved in CO2 fixation cycle and chlorophyll inactivation from the oxidative stress induced by pollutants [12,13]. Photosynthesis efficiency of plants is pH dependent and at lower acidic pH photosynthesis efficiency of plants gets reduced [14]. Thus, the resistance of plants to the air pollutant-induced pH changes could determine the tolerance to air pollution. In our study, in B. spectabilis and L. aspera with pH of 6.88–6.91 recorded higher APTI [Table 1]; however, no significant [Figure 3] correlation of pH of plants with air pollution tolerance was observed.
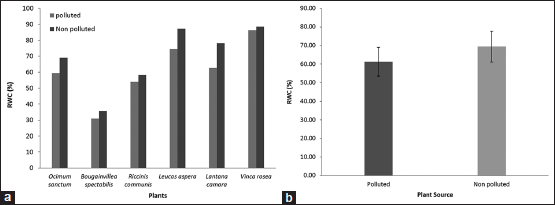 | Figure 1: (a and b) Relative water content of selected plants from polluted and non-polluted area [Click here to view] |
3.3. Stomatal Index
The stomatal index of plants from polluted and NP areas is summarized in Figure 4a. The mean stomatal index of plants from polluted environment was found to be significantly (P < 0.05) decreased (17.51 ± 0.54 in polluted v/s 18.84 ± 0.65 in NP; Figure 4b. Highest effect of pollution was observed in O. sanctum (20.50 in NP v/s 17.01 in polluted; 17% reduction in index). In all other plants tested showed slight reduction in stomatal index. Similarly, the effect of air pollution on response to roadside plants with respect to significant reduction in stomatal index in all the plant species growing in polluted area was studied [2]. In contrast, another reported increase in stomatal index in plants from highly polluted sites [15]. Stomatal behavior of plants in response to air pollutants within plant species was reported [16]. Further studies on response of plants to various pollutants are necessary to understand the foliar adaptation of plants exposed to air pollution.
3.4. Total Chlorophyll
Total chlorophyll content of selected plants from polluted and NP areas is summarized in Figure 5a. The mean chlorophyll content of polluted plants was significantly reduced (P < 0.01) at 582.30 ± 21.30 μg/g compared to 633.27 ± 28.60 μg/g [Figure 5b]. Highest and lowest total chlorophyll content of 715.12 μg/g and 519.48 μg/g was recorded in L. aspera from NP area and O. sanctum from polluted area, respectively. Highest impact of air pollution on total chlorophyll content was recorded in L. aspera and R. communis where 11–13% reduction in chlorophyll was observed. In L. aspera, total chlorophyll content of 620.89 μg/g was observed in polluted compared to 715.12 μg/g observed in NP in L. aspera. Similarly, in R. communis plant, total chlorophyll content of 586.69 μg/g was observed in polluted compared to 660.26 μg/g observed in NP area. In other plants from polluted area, 5–7% reduction in total chlorophyll content was noted. Total chlorophyll content is an important biochemical factor that impacts photosynthetic activity which determines the plant growth. Total chlorophyll content is considered frequently to evaluate the impact of air pollution on plants [4]. Several studies have reported reduction in total chlorophyll content in plants exposed to air pollutants. Effect of PM in polluted area on reduction of chlorophyll content at the enzyme level and correlated with increased activity of chlorophyllase enzyme activity was studied [17]. Reduction in total chlorophyll content to reduce gaseous exchange due to blockage of stomatal opening in response to air pollutants was analyzed [18]. The study on inverse relationship of total chlorophyll content with dust accumulation on leaves in polluted environment was reported [19]. In our study, the reduced total chlorophyll content could be due to the reduced stomatal index. Comparative analysis of the correlation of total chlorophyll content with air pollution tolerance indices showed no significant correlation [Figure 3c]. Further, detailed correlation analysis on influence of various physicochemical factors on photosynthetic pigments synthesis and activity should help in identifying adaptive plants with sustained growth in polluted environments.
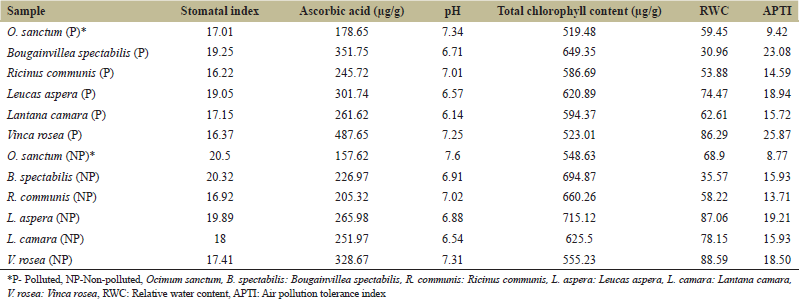 | Table 1: APTI of selected plants from polluted and non-polluted area [Click here to view] |
 | Figure 2: (a and b) pH of selected plants from polluted and non-polluted area [Click here to view] |
 | Figure 3: (a-e) Correlation of air pollution tolerance index with physicochemical characteristics of roadside plants [Click here to view] |
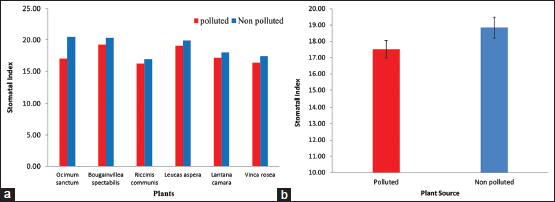 | Figure 4: (a and b) Stomatal index of selected plants from polluted and non-polluted area [Click here to view] |
 | Figure 5: (a and b) Total chlorophyll content of selected plants from polluted and non-polluted area [Click here to view] |
 | Figure 6: (a and b) Ascorbic acid content of selected plants from polluted and non-polluted area [Click here to view] |
3.5. Ascorbic Acid Content
Ascorbic acid content of selected plants from polluted and NP areas is summarized in Figure 6a. The mean ascorbic acid content of polluted plants was significantly increased (P < 0.05) at 304.52 ± 7.04 μg/g compared to 239.42 ± 23.69 μg/g in NP areas [Figure 6b]. Highest and lowest total ascorbic acid content of 487.65 μg/g and 157.62 μg/g recorded in V. rosea from polluted area and O. sanctum from NP area, respectively. Highest impact of air pollution on total ascorbic acid content was recorded in B. spectabilis (351.75 μg/g in polluted v/s 226.97 in NP area) and V. rosea (487.65 in polluted vs. 328.67 μg/g in NP area) with 55% and 48% increase, respectively, in ascorbic acid content was observed. Moderate impact of air pollution on ascorbic acid content was observed in R. communis (245.72 in polluted v/s 205.32 μg/g in NP area), O. sanctum (157.62 in polluted v/s 178.65 μg/g in NP area), and L. aspera (301.74 in polluted v/s 265.98 μg/g in NP area) where 13–20% increase in ascorbic acid content was recorded [Table 1]. In L. camara, 4% increase in ascorbic acid content was observed (261.62 in polluted v/s 251.97 μg/g in NP area). Several researchers have studied and reported positive correlation of air pollution on ascorbic acid content [19-21].
Ascorbic acid is an important antioxidant which provides resistance from stress in plants by neutralizing the free radicals generated that can affect the biochemical and physiological activity [22,23]. Thus, ascorbic acid is an important determinant that decides the plants ability to nullify and withstand the toxic effects of air pollutants [24,4]. Correlation of air pollution tolerance indices of plants with all the parameters revealed positive correlation with only ascorbic acid content (R2=0.88, Figure 3e). A study reported similar findings of positive correlation of APTI with ascorbic acid content of plants [19].
3.6. APTI
APTI of selected plants from polluted and NP areas is summarized in Table 1. APTI of plants from polluted area ranged from 9.42 to 25.87. APTI of plants from non-polluted area ranged from 8.77 to 19.21. Lowest APTI was recorded for O. sanctum selected from both polluted and non-polluted area at 9.42 and 8.77, respectively, indicating that it is sensitive to air pollution. Highest APTI of 25.87 was recorded for V. rosea followed by B. spectabilis with APTI of 23.08. Moderate APTI of between 12 and 16 was observed in different plants selected from polluted sites in the order of L. aspera (APTI 18.94) >L. camara (APTI 15.72) >R. communis (APTI 14.59). Among the plants selected from non-polluted areas, the APTI score was in the order of L. aspera (APTI 19.21) >V. rosea (APTI 18.50) >B. spectabilis and L. camara (APTI 15.93) >R. communis (APTI 13.71)>O. sanctum (APTI 8.77). APTI indices in plants reveal that the plants vary in their response to environmental pollution and their tolerance to air pollution is determined by their ability to undergo physicochemical adaptation to either prevent pollutants or mitigate the stress induced by pollutants through the antioxidant. Ascorbic acid content in the plants can be used for screening of plants with favorable tolerance to air pollution. The findings indicate that the plants B. spectabilis and V. rosea can be selected for growing in polluted environments of Bengaluru.
4. CONCLUSIONS
In the present study, comparative analysis of APTI indices of six common plants growing in the polluted areas and NP control area in Bengaluru was analyzed as a biomonitoring tool to assess the response of plants to air pollution-induced stress. The study findings reveal that V. rosea and B. spectabilis can be effectively used for the amelioration of air pollution effects. Further, efforts to evaluate these plants to ameliorate air pollutants at heavily polluted urban environments should facilitate exploring these plants for restoration of green urban ecosystem.
5. CONFLICTS OF INTEREST
All the authors declare that there are no conflicts of interest with respect to the data provided and the authors do not claim for any funding sources.
6. REFERENCES
1. Raabe OG. Respiratory exposure to air pollutants. In: Swift DL, Foster WM, editors. Air Pollutants and the Respiratory Tract. New York, USA: Marcel Dekker Inc.; 1999.
2. Prabhat KR. Biodiversity of roadside plants and their response to air pollution in an Indo-Burma hotspot region: Implications for urban ecosystem restoration. J Asia Pac Biodivers 2016;9:47-55. CrossRef
3. Singh SK, Rao DN. Evaluation of Plants for Their Tolerance to Air Pollution. In: Proceedings Symposium on Air Pollution Control, Indian Association for Air Pollution Control; 1983. p. 218-224.
4. Singh SK, Rao DN, Agrawal M, Pandey J, Narayan D. Air pollution tolerance index of plants. J Environ Manag 1991;32:45-55. CrossRef
5. Singh A. Practical Plant Physiology. New Delhi: Kalyari Publishers; 1977.
6. Sadasivam S, Balasubraminan T. In: Practical Manual in Biochemistry. Coimbatore: Tamil Nadu Agricultural University; 1987.
7. Arnon DI. Copper enzymes in isolated chloroplasts. Polyphenol oxidase in Beta vulgaris. Plant Physiol 1949;24:1-15. CrossRef
8. Paulsamy S, Sivakumar R, Latha N. Evaluation of air pollution tree species in Coimbatore city. J Ecol Res Biocon 2000;1:20-3.
9. Keller T, Schwager H. Air pollution and ascorbic acid. Eur J For Pathol 1977;7:338-50. CrossRef
10. Tsega YC, Prasad AD. Variation in air pollution tolerance index and anticipated performance index of roadside plants in Mysore, India. J Environ Biol 2014;35:185-90.
11. Agrawal AL. Air Pollution Control Studies and Impact Assessment of Stack and Fugitive Emissions from CCI Akaltara Cement Factory. Project Report, Project Sponsored by M/s. CCI Akaltara Cement Factory. Nagpur: NEERI; 1988.
12. Tanaka K, Otsubo T, Kondo N. Participation of hydrogen peroxide in the inactivation of Calvin-cycle SH enzymes in SO2-fumigated spinach leaves. Plant Cell Physiol 1982;28:1009-18.
13. Choudhary CS, Rao DN. Study of some factors in plants controlling their susceptibility to SO2 pollution. Proc Indian Natl Sci Acad 1977; 43:236-41.
14. Yan-ju L, Hui D. Variation in air pollution tolerance index of plant near a steel factory: Implications for landscape-plant species selection for industrial areas. WSEAS Trans Environ Dev 2008;1:24-30.
15. Gostin I. Air pollution effects on the leaf structure of some Fabaceae species. Notulae Bot Horti Agrobotanici Cluj-Napoca 2009;37:57–63.
16. Robinson MF, James H, Mansfield TA. Disturbances in stomatal behaviour caused by air pollutants. J Exp Bot 1998;49:461-9. CrossRef
17. Prajapati SK. Ecological effect of airborne particulate matter on plants. Environ Skeptism Crit 2012;1:12-22.
18. Leghari SK, Zaidi MA. Effect of air pollution on the leaf morphology of common plant species of Quetta city, Pakistan. Pak J Bot 2013;45:447-54.
19. Bharti SK, Kumar D, Anand S, Poonam, Barman SC, Kumar N. Characterization and morphological analysis of individual aerosol of PM10 in urban area of Lucknow, India. Micron 2017;103:90-8. CrossRef
20. Govindaraju M, Kumar RS, Muthukumaran VR, Visvanathan P. Identification and evaluation of air-pollution tolerant plants around lignite-based thermal power station for greenbelt development. Environ Sci Pollut Res 2012;19:1210-23. CrossRef
21. Pandey AK, Pandey M, Mohan S, Tiwary M, Tripathi BD. Air pollution tolerance index and anticipated performance index of some plant species for development of urban forest. Urban for Urban Green 2015;14:866-71. CrossRef
22. Keller T. The electrical conductivity of Norway spruce needle diffusate as affected by air pollutants. Tree Physiol 1986;1:85-94. CrossRef
23. Conklin PL. Recent advances in the role and biosynthesis of ascorbic acid in plants. Plant Cell Environ 2001;24:383-94. CrossRef
24. Aghajanzadeh T, Hawkesford MJ, De Kok LJ. Atmospheric H2S and SO2 as sulfur sources for Brassica juncea and Brassica rapa: Regulation of sulfur uptake and assimilation. Environ Exp Bot 2016; 124:1-10. CrossRef