
1. INTRODUCTION
The snakehead murrel Channa striata (Bloch, 1793) is a candidate food fish in South Asian countries due to its nutritional and medicinal importance [1]. It has high-quality flesh and enriched taste along with high levels of polyunsaturated fatty acids [2,3]. Evidence suggests that post-operative medicinal application tends to improve wound healing and reduce postoperative pain and discomfort [4,5]. This has also been reported in the treatment of tuberculosis [6], the application of antiulcer [7], the application of antidepressants [8], the treatment of asthma [9], and fertility [10]. Culturing murrel has gained substantial popularity in India in the last decade due to its wide range of natural habitats, ranging from rivers, swamps, ponds, canals, and lakes to land containing rice fields. Murrels are carnivorous fish species and bottom dwellers and can survive harsh environmental conditions, such as lower oxygen levels and higher amounts of ammonia (NH3). This air-breathing fish species has typical characteristics, and the epithelial layer of skin is covered with a substantial mucosal layer compared to other fishes, which acts as a physical barrier against infection [11].
Mucosal surfaces of vertebrates, including fishes, are known to colonize a wide range of complex microbial communities and are involved in various biological processes in the host, including the immune system. The gut-associated microbiota, in particular, plays a key role in the immunological and metabolic development of the host [12,13]. Several factors can influence the structure and composition of the host-associated microbiota, such as the environment (rearing condition), feeding (nutritional content), and biological conditions [14-16]. Most of the research performed in fish microbiota is focused mainly on gut microbes. Therefore, a change in diet or feeding habits can be considered an important factor that alters host-associated microbiota, which influences the nutritional regulation of host energy balance [17-19]. The feeding and fasting cycle alters the metabolism of the host and microbial load or composition [20]. These studies depict the complex nature of the gut microbial community and imply its dynamics, largely modulated by dietary ingredients and feeding regimes [21-24].
Despite the increasing knowledge of relationships between diet and the gut microbiota, very little is known about microbiota associated with other mucosal surfaces, such as skin. Nevertheless, few studies have been performed to understand the complexity of the skin-mucus-linked microbiota of fish, for example, Atlantic salmon and eel. [25-29] and revealed a shift in their composition due to stress, feeding, and other environmental factors [30,31].
Murrels are emerging as an excellent model due to their carnivorous feeding habits and unique characteristics such as their high level of skin mucosa, which makes them unusual relative to other fish species. Therefore, characterization and understanding of the role of the microbial community-associated skin and gut will serve as baseline information for framing successful farming practices for murrels, including the development of probiotics. At present, advances in next-generation sequencing (NGS) technologies and high-performance computing have brought about paradigm progress in the field of metagenomics, allowing the study of unexplored complex microbiota. In this study, we used the 16S rRNA gene sequencing method to discover and characterize the bacterial composition of the skin-mucus and gut of murrels during feeding and starvation conditions. Furthermore, we performed predictive metabolic pathway analysis (PICRUSt) of the bacterial communities associated with murrels. This metagenomic study will help in the investigation of microbes from the fish skin-mucus and gut linked with metabolism and health/immunity and the detection of novel microbes to aid in the development of probiotics and antibiotics in aquaculture.
2. MATERIALS AND METHODS
2.1. Experiment and DNA Extraction
A total of 100 healthy murrels (5 ± 0.5 g) were collected from the air-breathing catfish rearing facility of the ICAR-Central Institute of Freshwater Aquaculture, Bhubaneswar, Odisha, India. The collected fish were acclimatized for 2 days in 200 L glass tanks under laboratory conditions at 28.5°C. All fishes were fed twice a day with commercial feed at a rate of 3% of their body weight. The feed was composed of protein (>25%), fat (>2%), carbohydrates (<10%), fiber (<3%), calcium (>0.5%), and phosphorus (>0.5%). After 48 h of acclimatization, these fish were randomly divided into two treatment groups (feeding and fasting) and placed in two 20 L glass tubes with a density of ten fish per tank. The first group of fishes was starved for 48 h, and the other group of fishes designated the control was fed twice a day with commercial feed. After completion of the experiment, fish were collected and immediately transported to the Fish Pathology Laboratory of ICAR-CIFA. The collected fish were anesthetized with 150 mg/L MS222 (tricaine methane sulfonate, Sigma Aldrich) and rinsed with sterile water to prevent cross-contamination. Skin-mucus was collected from three fishes randomly chosen from each treatment group by scraping off the dorsolateral surface of the fish using a sterile scalpel. The mucus samples obtained from fish in each treatment group were pooled separately and collected in 1.5 ml microcentrifuge tubes. Gut samples from the same fish were collected by aseptically removing the whole intestine from the abdominal cavity and squeezing into a sterile tube. Gut contents from three individuals were pooled together to form a single biological sample. The samples were pooled to eliminate the interindividual variations among fishes receiving the same treatment. All samples were stored at −80 °C until further processing.
Genomic DNA from skin-mucus and gut samples was extracted using the QIAamp DNA Mini Kit (Qiagen/Gmbh, Hilden, Germany) according to the manufacturer’s protocol. The mucus samples were centrifuged for 5 min before DNA extraction. The quality and quantity of the isolated DNA were assessed using a UV spectrophotometer (Nano Drop™, Thermo Fisher Scientific, Waltham, MA, USA) and stored at −20°C until further analysis.
2.2. Illumina NGS Library Preparation, Sequencing, and Computational Analysis
The V3 to V4 regions of the 16S rRNA gene were amplified by polymerase chain reaction (PCR) using the universal bacterial primer pair (5′-CCTACGGGNGGCWGCAG-3′ and 5′-GACTACHVGGGTATCTAATCC-3’) following the 16S Metagenomic Sequencing Library Preparation for Illumina MiSeq System (Illumina, San Diego, CA, United States). The V3-V4 primer pairs of 16S rRNA regions are mostly used for bacterial microbiome sequencing using NGS [32]. The 16S rRNA amplicons/fragments were generated using the Platinum® Taq DNA Polymerase High Fidelity Kit (Thermo Fisher Scientific, Italy). The procedure for 16S rRNA gene library preparation and sequencing was adopted from a previous report [33]. In this study, a Nextera XT Index Kit (Illumina, San Diego, CA) was used for fragment ligation with paired-end adapters; subsequently, the quality of libraries was checked using a KAPA library quantification kit as per the procedure. The libraries were then multiplexed, and sequencing was carried out using Illumina MiSeq (San Diego, CA, USA) by paired-end 2 × 250 bp sequencing chemistry.
The raw reads generated from sequencing were assessed and quality filtered using the following criteria: (i) barcodes/adapters and primers were removed from the sequences; (ii) sequences with an overlapping region below 10 bp were discarded; and (iii) sequences that contained an “N” base >300 bp were trimmed. To reconstruct the original contigs, overlapping paired-end reads were aligned using FLASH v1.2.11 software (http://sourceforge.net/projects/flashpage). The resulting reads were subjected to Fast QC for quality checking (Q>30), and the adaptor was trimmed using Trimmomatic v0.33. Furthermore, the trimmed paired-end quality read sequences were processed using QIIME v1.9.1 (Quantitative insights into microbial ecology) with default parameters [34]. The filtered reads were clustered using the UCLUST method [35]. Then, the sequence data were assigned to the operational taxonomic units (OTUs) with 97% sequence similarity against the curated chimera-free 16S rRNA database (Greengenes v13.8) through the Ribosomal Database Project (RDP) classifier, and an abundance of OTUs<0.001% of the total sequences was discarded. The taxonomic information of the representative sequence in each OTU was obtained by matching the sequence database using BLAST of QIIME. The bar graph for the samples was generated using QIIME. Alpha diversity metrics were calculated based on a rarefied OTU table (rarefied at the lowest sample size) using “Observed species,” “Chao1 index” (species diversity estimator), “Shannon,” and “Simpson” diversity indices. The alpha and beta diversity plots were generated using the phyloseq and microbiomseq packages with ANOVA in R (v4.0.2). A bubble plot was generated using ggplot2 and the reshape2 package in R (v4.0.2). The variation in species composition between/among bacterial communities was measured using an unweighted (presence/absence) UniFrac distance matrix [36,37]. The distance matrices were visualized by principal coordinate analysis (PCoA). A Venn diagram was utilized to recognize and visualize the common core microbiome (http://bioinformatics.psb.ugent.be/webtools/Venn/), and statistical analysis was performed using Paleontological Statistics Software Package for Education (PAST) software v3.0 [38]. Differences were considered significant at P < 0.05.
To identify the metabolic role/functions of bacterial communities, the PICRUSt algorithm was used with 97% similarity OTUs clustered for each sample [39]. All OTUs were normalized by copy number, and new matrices of predicted functional categories were created using the Cluster of Ortholog Genes (COG) and Kyoto Encyclopedia of Genes and Genomes (KEGG) databases. The results were summarized at different levels using QIIME. The predicted functional table for PICRUSt analysis is available on the Open Science Framework platform. The heat maps of the hierarchy cluster and metastatic analysis were constructed based on the abundances of each hierarchy.
3. RESULTS
Illumina sequencing generated a total of 1,098,230 raw reads from the gut and skin-mucus samples of murrel. Out of this, 270,003, 294,797, 237,159, and 296,271 total paired-end reads were generated for the four different samples, that is, gut (starved), gut (fed), skin-mucus (starved), and skin-mucus (fed). After quality filtering, we obtained 576,176 high-quality reads that were clustered into 395, 467, 954, and 858 OTUs from each sample type [Table 1]. Due to differences in sequencing depth, the samples were rarefied, and alpha diversity, which represents microbial diversity within samples, was assessed for all skin-mucus and gut samples of murrel. We calculated the diversity using different matrices, such as Shannon, Simpson, Chao1, and observed species [Tables 2 and 3]. The H’ value of alpha diversity and the Shannon or Simpson index for skin-mucus of starved fishes were 3.82 and 0.76, respectively, which were significantly higher than those of the other groups (P < 0.05). The alpha diversity analysis revealed that the skin-mucus microbiome during fasting has the highest diversity and even distribution of microbes compared to all other groups. Compared to this, the gut microbiome during fasting showed more diversity but less evenness [Figure 1]. A Krona chart that allows exploration of relative abundances and confidences within the complex hierarchies of metagenome classifications was depicted using quantitative phylogenetic information of skin-mucus and gut samples of starved and fed fishes, respectively [Figure 2]. Actinobacteria and Proteobacteria were the most abundant phyla among the detected microbes. The taxonomic diversity reveals the contribution of each sample to the overall beta diversity represented by local contribution to beta diversity (LCBD). The starved skin-mucus showed a higher LCBD value than all other samples [Figure 3]. The relative abundances of the complex hierarchies in skin-mucus and gut metagenome classifications of starved and fed fishes were depicted using bubble plots. [Figure 4]. The relative abundances of Arthobacter and Rhodococcus were highest in all samples, with Vogesella, Micrococcus and Acinetobacter being more abundant in skin-mucus under starved conditions than in the rest of the samples. The metagenome data were deposited in the GenBank database of NCBI as a Short Read Archive (Accession numbers: SRR10662778; SRR10662777; SRR10662776; SRR10662775). The skin-mucus microbiome at the phylum level was more abundant in fed fishes than in starved fishes. Alterations in the abundance and diversity of microbes were also observed at different levels of taxa and OTUs in the skin-mucus and gut of murrel. The Shannon diversity index was calculated for each treated and control fish based on the 95% most abundant taxa in these samples.
Table 1: Metagenomics read statistics showing total number of paired end and processed reads along with the number of OTUs in each taxonomic rank in the skin-mucus and gut microbiome of starved and fed fish.
| Category | Skin-mucus (Starved) | Skin-mucus (Fed) | Gut (Starved) | Gut (Fed) |
|---|---|---|---|---|
| Total paired end reads | 237159 | 296271 | 270003 | 294797 |
| Processed reads | 232637 | 290887 | 264995 | 289224 |
| Total identified rRNA sequences | 119887 | 160201 | 139681 | 156407 |
| Total OTUs picked | 954 | 858 | 395 | 467 |
| Phylum | 16 | 20 | 14 | 12 |
| Class | 34 | 40 | 25 | 25 |
| Family | 118 | 131 | 93 | 98 |
| Order | 48 | 46 | 54 | 67 |
| Genus | 255 | 225 | 142 | 165 |
| Species | 319 | 267 | 160 | 199 |
Table 2: Alpha diversity index across various matrices. The alpha diversities in the skin-mucus of starved fishes were highest for all the matrices.
| Samples | Shannon | Simpson | Chao1 | Observed species |
|---|---|---|---|---|
| Skin-mucus (Starved) | 3.8253329 | 0.76399317 | 1359.06410 | 954.0 |
| Skin-mucus (Fed) | 2.2693090 | 0.52400006 | 1261.277027 | 858.0 |
| Gut (Starved) | 2.16310180 | 0.555559836 | 512.424242 | 395.0 |
| Gut (Fed) | 1.99158492 | 0.498923358 | 649.397058 | 467.0 |
Table 3: Functional diversity index calculating using QIIME: The functional diversity was classified based on KEGG and COG classification system and the indices were calculated for Shannon, Simpson, and Chao1.
| Samples | Shannon | Simpson | Chao1 |
|---|---|---|---|
| KEGG | |||
| Skin-mucus (Starved) | 10.9228537996 | 0.9992140606 | 5812.38709677 |
| Skin-mucus (Fed) | 10.6795682317 | 0.9990719864 | 5753.72727273 |
| Gut (Starved) | 10.6957903364 | 0.9990861413 | 5569.36842105 |
| Gut (Fed) | 10.6523593585 | 0.9990617187 | 5502.95854922 |
| COG | |||
| Skin-mucus (Starved) | 10.5522169053 | 0.9985284645 | 4360.15 |
| Skin-mucus (Fed) | 10.3474153491 | 0.9983079074 | 4336.5 |
| Gut (Starved) | 10.3598447277 | 0.9983065096 | 4274.875 |
| Gut (Fed) | 10.3336271975 | 0.9983042549 | 4265.58823529 |
KEGG: Encyclopedia of Genes and Genomes, COG: Cluster of Ortholog Genes
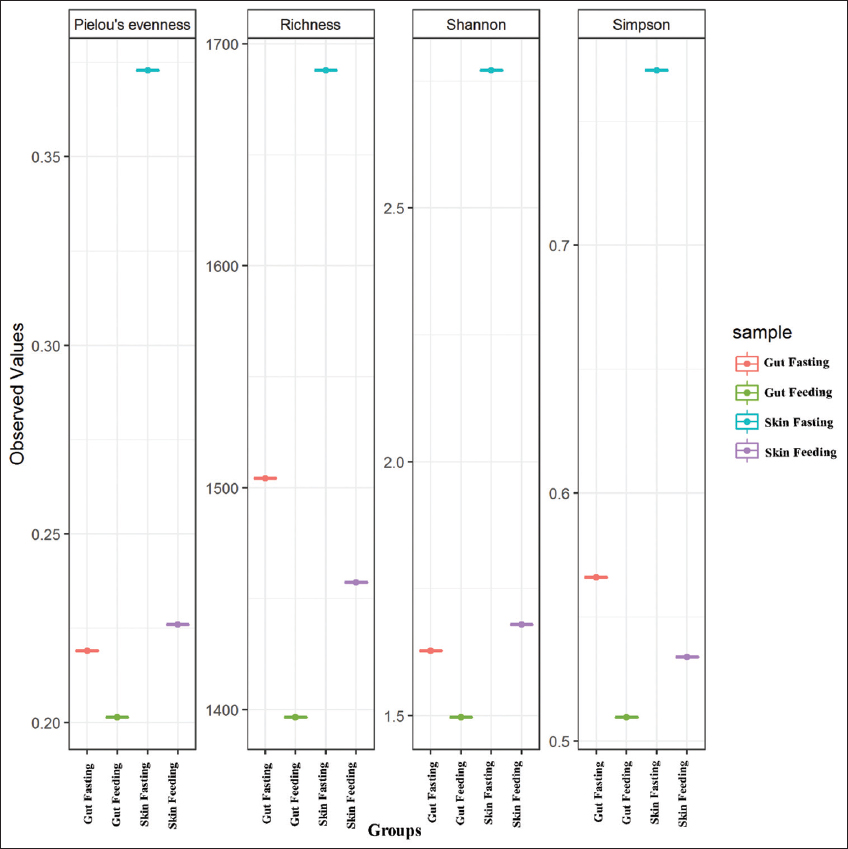 | Figure 1: Alpha diversity indices (Pielou’s evenness, Richness, Shannon and Simpson) for 4 groups of samples (gut fasting, gut feeding, skin-mucus fasting, and skin-mucus feeding). [Click here to view] |
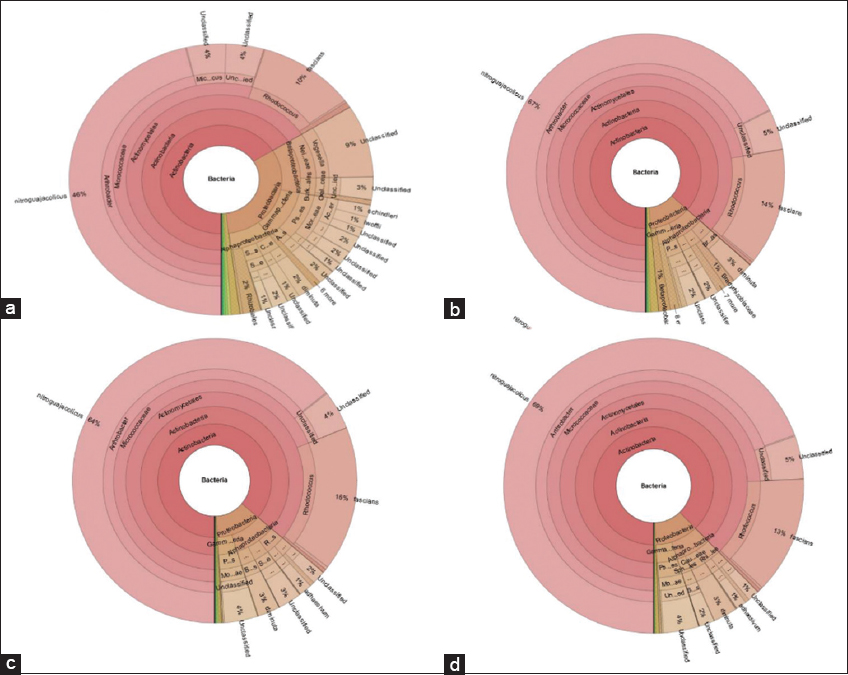 | Figure 2: Krona chart for the taxonomic classification of the bacterial metagenome from Channa striata (a) skin-mucus (starved), (b) Skin-mucus (fed), (c) Gut (starved), and (d) Gut (fed). The inner circle represents higher taxonomic ranks, while more detailed taxonomic ranks (up to genus level) are presented in the outer circles. [Click here to view] |
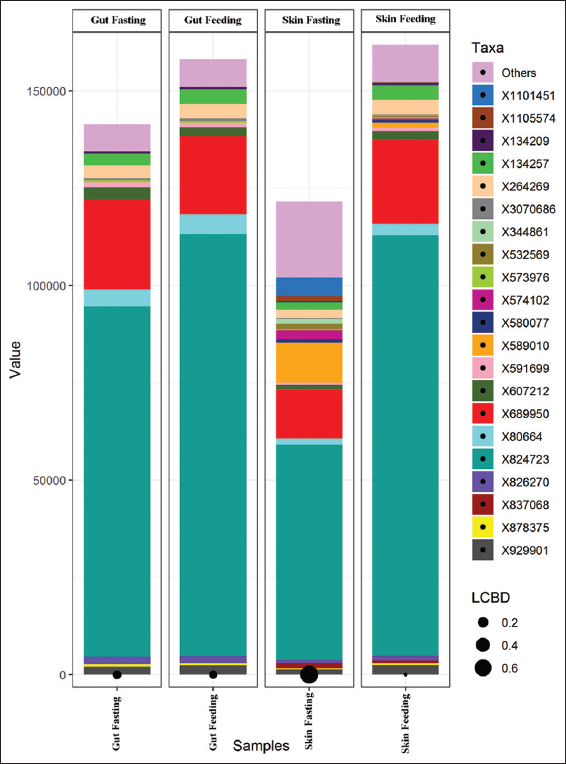 | Figure 3: Taxonomic diversity of gut and skin-mucus microbiome in feeding and fasting conditions. [Click here to view] |
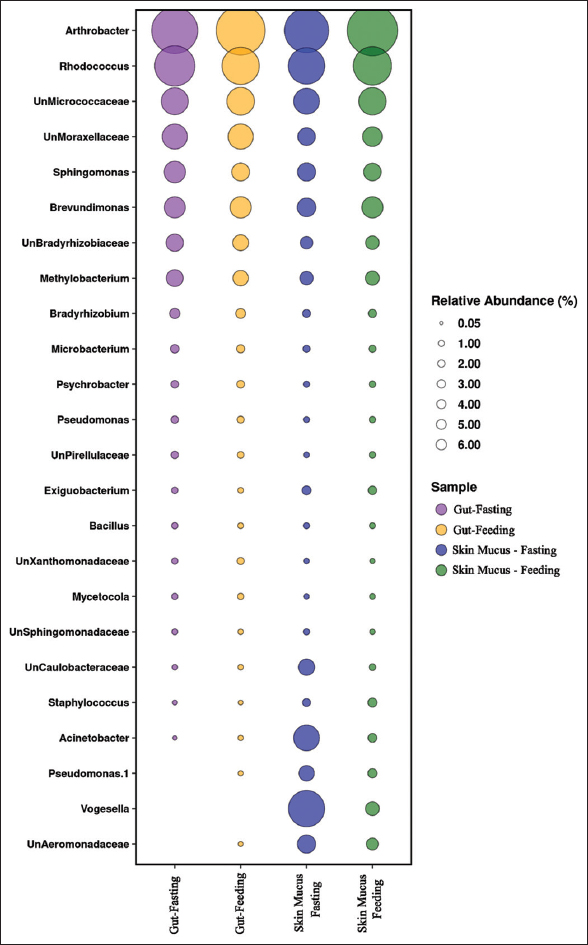 | Figure 4: Bubble plot for four groups of samples (skin-mucus fasting, skin-mucus feeding, gut fasting, and gut feeding) showing the relative abundance of top genera. [Click here to view] |
3.1. Gut Microbial Communities of Murrel
The bacterial diversity linked with the murrel gut consisted of a total of 14 and 12 different bacterial phyla in starved and fed fishes, respectively [Figure 5]. Actinobacteria and Proteobacteria represented the most abundant phyla, which together accounted for 99% of the total population in the gut of both samples. Actinobacteria was the most abundant phylum in the gut, with a slightly higher abundance (87.78%) in the gut fed than in the gut starved (86.15%). Proteobacteria was found to be the second-highest dominant phylum, representing 11.62% and 13.11% in the gut of fed and starved fishes, respectively. Overall, 12 phyla were present in gut samples of both starved and fed fishes. Other phyla, such as Firmicutes (0.30%), Verrucomicrobia (0.12%), Planctomycetes (0.0908%), Cyanobacteria (0.0281%), Bacteroidetes (0.0275%), and Fusobacteria (0.0013%), were identified in the gut of fed fishes. In starved fishes, the abundances of these phyla were represented as Firmicutes (0.26%), Planctomycetes (0.13%), Verrucomicrobia (0.13%), Fusobacteria (0.1038%), Cyanobacteria (0.0458%), and Bacteroidetes (0.0365%). Interestingly, this study identified the presence of two phyla, TM7 (0.0021%) and Chlamydiae (0.0007%), found exclusively in starved fishes. The taxonomic distribution at the order level showed the composition of different groups of Actinobacteria, such as Actinomycetales, Acidimicrobiales, Solirubrobacterales, and Gaiellales, which were found to be abundant in both fishes. In the Proteobacteria phylum, out of 22 orders, Pseudomonadales was highly abundant.
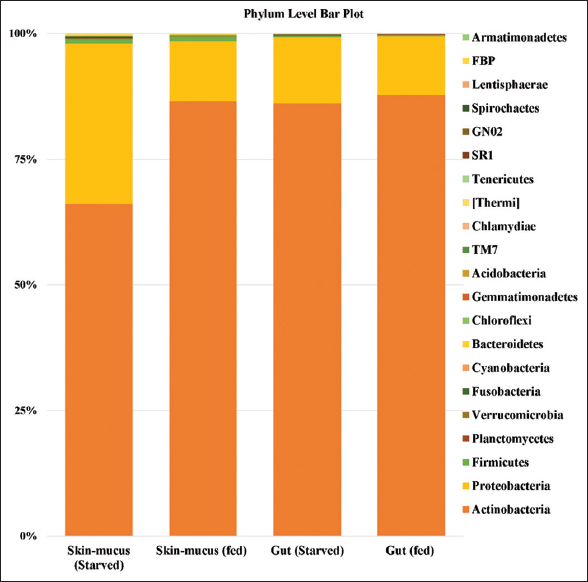 | Figure 5: Stacked column bar graph showing the distribution and abundances of bacteria at the phylum level in Channa striata fed with control formulated diet and starved. Y-axis represented the percentage of abundance and X-axis represents the different sample. [Click here to view] |
At the genus level, the taxonomic composition of microbes detected a total of 142 and 165 genera in the gut of both starved and fed fish. We detected approximately 64–91 unclassified genera in both samples. Arthrobacter (64.97–69.54%) was the most abundant genus, followed by Rhodococcus (13.12–16.82%), Sphingomonas (1.67–2.62%), Brevundimonas (2.50–2.55%), and Methylobacterium (1.17–1.46%), in both gut samples. Interestingly, the gut of starved fish was enriched with a higher percentage of Rhodococcus than that of fed fish. In contrast, we detected a high level of Arthrobacter in the gut samples of fish fed to the counterpart of starved fish. At the family level, Micrococcaceae (68.19–74.26%) was most diverse in the gut, followed by Nocardiaceae (13.12–16.82%), Moraxellaceae (3.94–3.99%), Caulobacteraceae (2.55–2.6%), Sphingomionadaceae (1.71–2.69%), etc. In the Arthrobacter genera, various species, such as Arthrobacter nitroguajacolicus, Arthrobacter oxydans, Arthrobacter psychrolactophilus, Arthrobacter woluwensis, and Arthrobacter nicotinovoroas, were detected, among which A. nitroguajacolicus was the most abundant species in both samples (69.40% and 64.35% in gut samples of fed and starved fish, respectively). Among the Rhodococcus genera, species such as Rhodococcus fascians and Rhodococcus rubur were reported, and R. fascians was most abundant, at 16.45% and 12.87% in gut samples of both starved and fed fish, respectively.
3.2. Skin-mucus Microbiome of Murrel
A total of 954 and 858 OTUs of bacterial communities associated with skin-mucus at taxonomic resolution were identified in starved and fed fishes, respectively. As per the analyzed dataset, 16 and 20 phyla were present in the skin-mucus of both starved and fed fish, respectively. Actinobacteria was predominant, with a relative abundance of 66.07% and 86.48%, followed by other phyla, such as Proteobacteria (31.93% and 11.99%), Firmicutes (0.92% and 0.93%), Fusobacteria (0.32% and 0.001%), Bacteroidetes (0.22% and 0.18%), Thermi (0.26% and 1.35%), and Verrucomicrobia (0.092% and 0.094%), enriched in the skin-mucus of starved and fed fish, respectively [Figure 5]. At the order level, a total of 54 (skin-mucus starved) and 67 (skin-mucus fed) OTUs were found, and 4–6 unclassified orders were detected. The Actinomycetales order (Actinobacteria phyla) was abundant (66.08%, 86.45%) in the skin-mucus of starved and fed fish, followed by Pseudomonadales from Proteobacteria (8.88%, 3.02%), Neisseriales (8.65%, 0.88%), Burkholderiales (3.29%, 0.45%), Caulobacterales (3.24%, 2.62%), Sphingomonadales (2.95%, 1.71%), and Bacillales from Firmicutes (0.68%, 0.64%).
The taxonomic resolution at the genus level detected 255 and 224 genera in skin-mucus samples of starved and fed fish. A total of 124 unclassified genera were recognized in both murrel skin-mucus samples. Arthrobacter (order; Actinomycetales) was predominant, with relative abundances of 46.33% and 67.62% in the skin-mucus of starved and fed fish, respectively. Rhodococcus (order: Actinomycetales) showed the highest abundance (13.75%) in the skin-mucus of fed fish and lower abundance (10.73%) in the skin-mucus of starved fish. Brevundimonas (2.52% and 1.87%) and Methylobacterium (0.92% and 0.80%) were found in the skin-mucus of both fishes but showed the highest abundance in the skin-mucus of fed fish. Bacterial genera such as Micrococcus (4.18% and 0.04), Acinetobacter (3.99% and 0.24%), Enhydrobacter (1.98% and 0.29%), Sphingomonas (1.75% and 1.61%), and Pseudomonas (1.18% and 0.27%) showed varying levels of abundance in the skin-mucus of starved and fed fishes. In the Arthrobacter genera, various species, such as A. nitroguajacolicus, A. oxydans, A. psychrolactophilus, A. woluwensis, and A. nicotinovoroas, were detected, and among them, A. nitroguajacolicus was the most abundant species in both samples (69.40% and 64.35% in the skin-mucus). A. nitroguajacolicus was identified to be most abundant, consisting of 46.22% and 67.49%, followed by R. fascians (genus; Rhodococcus), attaining 10.49% and 13.54% in the skin-mucus of starved and fed fishes, respectively.
3.3. Comparative Studies of the Microbiome in the Skin-Mucus and Gut of Murrel
A total of 11 phyla were commonly present among all samples, namely, Actinobacteria (87.78–66.07%), Proteobacteria (31.93–11.62%), Firmicutes (0.93–0.26%), Planctomycetes (0.13–0.05%), Verrucomicrobia (0.13–0.092%), Fusobacteria (0.32–0.001%), Cyanobacteria (0.05–0.02%), Bacteroidetes (0.22–0.02%), Chlorooflexi (0.01–0.0006%), and Acidobacteria (0.0083–0.0025%) [Figure 5]. A higher percentage of Firmicutes and Cyanobacteria was identified in the skin-mucus of fed fishes. Similarly, the highest percentages of Proteobacteria, Fusobacteria, and Bacteroidetes were observed in the skin-mucus of starved fishes. At the genus level, 142–255 different bacterial genera were identified in all samples. A total of 184 genera were reported in the starved fishes, and 142 different genera were found in the skin-mucus of fed fishes. Arthrobacter, which was observed at the highest percentage in the gut sample of fed fishes, was, however, found to have the lowest percentage in the skin-mucus of starved fishes. Unclassified bacteria in the four samples accounted for 13.23%, 9.26%, 10.37%, and 10.40% of the total reads for the skin-mucus and gut of starved and fed fishes, respectively. Vogesella was abundant in the skin-mucus of starved fish (8.61%) compared to the skin-mucus of fed fish (0.8839), gut of starved fish (0), and gut of fed fish (0.0019). The abundances of Arthrobacter, Rhodococcus, Brevundimonas, and Sphingomonas increased in fed fish compared to starved fish. The principal coordinate analysis plot in Figure 6 shows principal coordinates PC1 versus PC2. In these analyses, a large shift in microbiota was observed in the skin-mucus of fishes after starvation. Skin-mucus (starved) had the highest OTU and clustered uniquely among the datasets in the PCoA plot. The gut-fed and gut-starved samples did not show a large shift in microbiota. A Venn diagram depicted the distribution of the common bacterial populations as well as the unique microbiota among the skin-mucus and gut of starved and fed fishes [Figure 7].
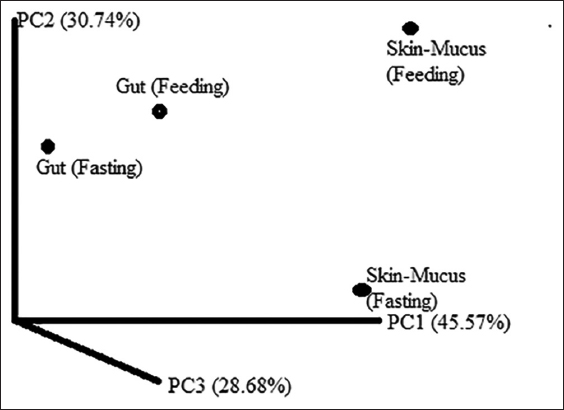 | Figure 6: Principal coordinate analysis plot (PC1 vs PC2) based on unweighted UniFrac distance matrix of four samples (Skin-mucus Fasting, Skin-mucus Feeding, Gut Fasting, and Gut Feeding). [Click here to view] |
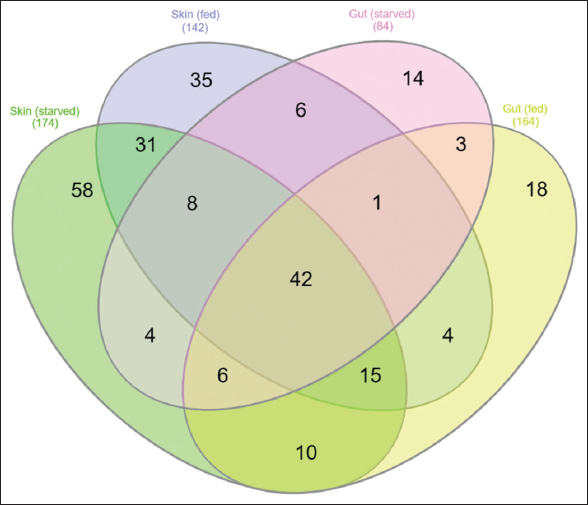 | Figure 7: Venn diagram of the unique and shared bacteria in genera level identified in four different types of samples. [Click here to view] |
3.4. Functional Classification
All 16S rRNA sequences were taken for the functional analysis study and predicted by using PICRUSt tools. The pathway was categorized up to three functional levels, that is, level 1, level 2, and level 3. The metabolism was reported as the most abundant function at level 1, for which skin-mucus and gut (in feeding condition) showed similar highest values, that is, 28.08% and 27.63%, respectively, compared to skin-mucus and gut (in starved condition), that is, 18.62% and 25.65%. The most differentially abundant KEGG pathway in level 2 was carbohydrate metabolism, amino acid metabolism, membrane transport, energy metabolism, lipid metabolism, and cofactors and vitamins; however, all these pathways were significantly higher under feeding conditions than under starvation conditions [Supplementary Figure S1]. Furthermore, 329 KEGG pathways were identified at level 3, out of which 12 pathways detected were significantly different between groups through metastatic analysis.
A total of 62.95% of murrel metagenomic sequences were observed to cluster to the COG functional groups through COG cluster analysis. At level 1, metabolism was the abundant COG detected in skin-mucus starved, skin-mucus fed, gut starved, and gut fed fishes at 44.26%, 45.82%, 45.91%, and 45.88%, respectively, followed by information storage and cellular processing and signaling. The top differentially abundant pathway (level 2) functions are depicted [Supplementary Figure S2], and the COG abundance of the skin-mucus of fed murrel was higher than that of the skin-mucus of starved fish. A heatmap was built to characterize and identify the KEGG categories (level 2) in different tissues [Supplementary Figure S3]. The Spearman correlation between selected pathways is shown with P-value; red indicates the highest P-value, and blue represents the lowest P-value. Larger (absolute) values were found for lipid metabolism, carbohydrate metabolism, amino acid metabolism, environmental metabolism, and metabolism of vitamins and cofactors.
4. DISCUSSION
The bacterial composition plays an important role in nutrition, immunity, and the development of vertebrates, including fishes [40]. Various studies have depicted an association of the bacterial community with host health [41-43]. NGS technologies have been utilized to identify and decipher the functional role of microbiota in several fish species [44-47]. Earlier studies have reported that Proteobacteria, Fusobacteria, Firmicutes, Bacteroidetes, Actinobacteria, and Verrucomicrobia are the predominant phyla in the gut of fish species. The microbial composition of the gut has experienced increased attention due to its crucial role in fish health and nutrition [48]. In this study, OTUs of the other groups were clustered based on the threshold level (approx. 97%), which showed the wealth of microbial content [49]. An earlier report suggested that Proteobacteria and Firmicutes are dominant and ubiquitous phyla in fishes, and a few reports have indicated that Fusobacteria and Proteobacteria are abundant phyla in freshwater fishes [45,50,51].
In contrast, our study indicated that Actinobacteria and Proteobacteria represented the predominant phyla, accounting for 95–99% of the total microbial composition in the gut and skin-mucus of murrel. The feeding regime mainly plays a key role in establishing bacterial diversity in the gut [23,52,53]. In this study, we revealed a smaller difference in the microbial diversity in both samples of starved and fed fish. The gut microbiota of rainbow trout (Oncorhynchus mykiss) increased in diversity (dominant phyla: Firmicutes and Proteobacteria) after the onset of first feeding [54,55]. These studies indicated that feeding habit or regime affects the gut microbiome in fishes [56-59]. Recently, Ramirez and Romero reported that bacterial communities were altered in gut samples of farmed and wild yellowtail kingfish (Seriola lalandi) due to feeding habits [60].
In this study, Actinobacteria was the predominant phylum observed in both starved and fed fish and was reported to be widely distributed in aquatic ecosystems. Interestingly, Actinobacteria groups are mainly helpful in the production of secondary metabolites and antibiotics to prevent the growth of pathogenic bacteria [61]. Earlier studies indicated that Actinobacteria play a key role in metabolism and immunity in gibel carp (Carassius auratus gibelio) fed traditional feed [62]. An increase in the abundance of Actinobacteria during the fasting phase may maintain/protect fish health by producing secondary metabolites. In Schizothorax zarudnyi and S. altidorsalis, the diversity of Actinobacteria in the gut indicated antibacterial (antimicrobial resistance, AMR) activity against the pathogenic bacteria of humans and fish and has the potential to generate biologically active compounds [63]. The key role of these phyla is suggested to be involvement in energy and nutrient cycling [64]. At the genus level, we detected Arthrobacter as an abundant genus, which showed a resolution of approximately 46.33% in the skin-mucus of starved fish and 67.62% in fed fish. In contrast, these genera were abundant in gut samples of fed fishes compared to those of starved fishes. The Arthrobacter genus is known to colonize bacterial growth in the gut of freshwater fishes [65]. Interestingly, at the species level, the abundance of Arthrobacter nitroguajacolicus indicated a unique role in murrel. This species has a vital role as a biocatalyst (nitrile-converting enzyme) for the production of acrylic acid from acrylonitrile through hydrolysis [66]. This group of bacteria is found in diverse ecologically enriched environments and is observed to thrive in stressful situations [67]. Arthrobacter nitroguajacolicus Rü61a is able to utilize quinaldine as a source of carbon and energy for degradation, as reported by Stephan Kolkenbrock [68]. This work reported the presence of essential bacterial groups responsible for producing biologically active compounds with antibacterial activity and their synthesis. Diversity indices such as Shannon and Simpson indices were measured based on the richness and evenness of bacterial species [69].
Rhodococcus (order: Actinomycetales) was the second-highest and most abundant genus in the murrel gut and skin-mucus. Earlier studies indicated that this genus has the ability to produce phytase in Catla catla [70]. Rhodococcus spp. has applications in bioprocess technology, bioremediation, pigment synthesis, and probiotics in aquaculture [71,72]. The gene encoding virulence factors have been identified from Rhodococcus fascians [73] and used as a catalyst for triacylglycerol synthesis [74].
The other phylum, Proteobacteria, was dominant in the gut and skin-mucus samples of murrel, which was also reported in Plectropomus leopardus during fasting conditions [75]. In this study, Vogesella (Proteobacteria) dominated the gut of starved fishes compared to fed fishes. Gammaproteobacteria were reported to be dominant in the gut of fishes during fasting, but in our study, these bacterial groups were abundant in the skin-mucus of murrel. Gammaproteobacteria were dominant in the gut and skin-mucus of fish from both the sea and rearing tanks [76-78]. The alteration in microbiome during starvation and feeding also affects the nutrition of the host and shows the linkage between host-microbe interactions [15,16,79]. It was reported that Firmicutes levels were altered during high intake of feed and indicated an inverse correlation with Bacteroidetes [80,81]. Our results showed that Alphaproteobacteria was dominant in the gut and skin-mucus of fishes. Brevundimonas (Caulobacteraceae), Sphingomonas (Sphingomonadaceae), Methylobacterium (Methylobacteriaceae), and an unclassified genus of the Moraxellaceae family of the dominant genus were identified in both the gut and skin-mucus. Earlier studies implied that Brevundimonas diminuta can be used as an important strain in water filtration systems as a quality controller for bacterial assays, given its antibiotic susceptibility [82]. Sphingomonas spp. has been utilized as a biocatalyst in bioremediation [83] and for generating exopolysaccharides as a gelling agent for the pharmaceutical and food industries [84]. It also has the ability to produce carotenoids, for example, β-carotene and nostoxanthin [85]. Alphaproteobacteria (59% of the total Proteobacteria) were abundant in the butterfly fish Chaetodon vagabundus [86]. In our study, we could not detect the abundance of Firmicutes and Bacteroidetes, possibly due to the carnivorous feeding habit of murrel, as earlier studies indicated that these groups of bacteria are abundant in fishes, where microbes help to degrade polysaccharides during metabolism [87]. Similarly, in T. tambroides, the gut microbiota is represented by high levels of Firmicutes and Bacteroidetes due to their habitat in the lake, which was enriched with periphyton algae [88]. Our results showed that Actinobacteria was the predominant phylum among the total microbiota of the skin-mucus and gut of murrel. Interestingly, the present study revealed that the microbiota composition of murrel was not affected by altered feeding conditions at a significant level, while earlier reports implied that microbiota was affected by host factors (genetics) as well as the environment [52,89,90].
5. CONCLUSION
This study provides baseline data on the microbial community associated with murrel and their possible contribution to host metabolism. This study revealed skin-mucus and gut microbial communities of murrel consisted of 22 bacterial phyla and were mainly dominated by Actinobacteria (66.07–87.78%) and Proteobacteria (11.62–31.93%) under both feeding and fasting conditions. Arthrobacter and Rhodococcus, known for improving fish performance in terms of growth, immunity, and nutrition, were more abundant in both gut and skin-mucus. Further, work is required to understand shifts in skin-mucus and gut microbiota after a prolonged period of starvation. This might reveal a significant alteration in the microbial profile and facilitate the discovery of novel microbes involved in starvation.
6. ACKNOWLEDGMENT
We are thankful to the Director, ICAR-Central Institute of Freshwater Aquaculture, Bhubaneswar for providing facility to undertake this work and the Director, ICAR-Indian Agricultural Statistics Research Institute, New Delhi for assisting in computational data analysis.
7. AUTHORS’ CONTRIBUTIONS
Jitendra Kumar Sundaray and Kiran D Rasal participated in conceptualization and designing of experiment. Sangita Dixit and Manohar Vasam acquired the data. Sangita Dixit, Pragyan Paramita Swain, Mir Asif Iquebal, Sarika Jaiswal and UB Angadi analyzed/interpreted the data. Kiran D Rasal, Pragyan Paramita Swain and Jitendra Kumar Sundaray drafted the manuscript. Prabhugouda Siriyappagouder and Dinesh Kumar did critical revision of manuscript. Mir Asif Iquebal, Sarika Jaiswal and UB Angadi carried out statistical analysis of the data. Rajesh Kumar and Jackson Debbarma participated in technical or material support, Jitendra Kumar Sundaray supervised the experiment. Jitendra Kumar Sundaray and Anil Rai approved the final manuscript.
8. FUNDING
The financial assistance to carry out this work was provided in the form of CABin (Center of Agricultural Bioinformatics) grant (F. no. Agril. Edn.4-1/2013-A&P), Indian Council of Agricultural Research, Department Agricultural Research and Education, Ministry of Agriculture and Farmers’ Welfare, Govt. of India.
9. CONFLICTS OF INTEREST
The authors report no financial or any other conflicts of interest in this work.
10. ETHICAL APPROVALS
All applicable international, national, and/or institutional guidelines for the care and use of animals were followed. The research undertaken complies with the current animal welfare laws in India. The care and treatment of animals used in this study were in accordance with the ethical guidelines of ICAR-Central Institute of Freshwater Aquaculture, Bhubaneswar, India.
11. DATA AVAILABILITY
The sequences generated in this study are deposited into the Genbank database of NCBI as Short Read Archive with Accession number: SRR10662778; SRR10662777; SRR10662776; SRR10662775.
12. PUBLISHER’S NOTE
This journal remains neutral with regard to jurisdictional claims in published institutional affiliation.
REFERENCES
2. Sahu BB, Kumar K, Sahoo AK, Kumar R, Mohanty UL, Sahoo NJ, et al. Carcass characteristics of marketable size striped murrel, Channa striatus (Bloch, 1793). J Appl Ichthyol 2012;28:258-60. [CrossRef]
3. Sahu BB, Kumar K, Sahu AK, Kumar R, Mohanty UL, Maji UJ, et al. Quality and storage stability of low acid Murrel (Channa striatus) fish pickle at room temperature. Int Food Res J 2012;19:1629.
4. Hossain MK, Latifa GA, Rahman MM. Observations on induced breeding of snakehead murrel, Channa striatus (Bloch, 1793). Int J Sustain Crop Prod 2008;3:e8.
5. Jais P, Haissaguerre M, Shah DC, Chouairi S, Gencel L, Hocini ML, Clementy J. A focal source of atrial fibrillation treated by discrete radiofrequency ablation. Circulation 1997;95:572-6. [CrossRef]
6. Ma'rufi I, Ali K, Sedemen IA, Purwanto P, Khoiri A. Channa striata (Ikan Gabus) extract and the acceleration of tuberculosis treatment:A true experimental study. Interdisciplin Perspect Infect Dis 2019;2019:8013959. [CrossRef]
7. Ali Khan MS, Mat Jais AM, Hussain J, Siddiqua F, Gopala Reddy A, Shivakumar P, et al. Gastroprotective effect of freeze dried stripped snakehead fish (Channa striata Bloch.) aqueous extract against aspirin induced ulcerogenesis in pylorus ligated rats. ISRN Pharmacol 2014;2014:327606. [CrossRef]
8. Haniffa MA, Sheela PA, Kavitha K, Jais AM. Salutary value of haruan, the striped snakehead Channa striatus-a review. Asian Pac J Trop Biomed 2014;4:S8-15. [CrossRef]
9. Susibalan BD, Abdullah B, Mat Lazim N, Abdul Kadir A. Efficacy of snakehead fish (Channa striatus) in subjects with allergic rhinitis:A randomized controlled trial. Orient Pharm Exp Med 2018;18:209-15. [CrossRef]
10. Hidayati D, Abdulgani N, Ashuri NM, Sa'adah NN, Lukitasari M. The influence of snakehead (Channa striata) fish extract to increase hyperglycemic mice fertility based on spermatogenic cell composition. AIP Conf Proc 2017;1854:020015. [CrossRef]
11. Wang S, Wang Y, Ma J, Ding Y, Zhang S. Phosvitin plays a critical role in the immunity of zebrafish embryos via acting as a pattern recognition receptor and an antimicrobial effector. J Biol Chem 2011;286:22653-64. [CrossRef]
12. Maynard CL, Elson CO, Hatton RD, Weaver CT. Reciprocal interactions of the intestinal microbiota and immune system. Nature 2012;489:231-41. [CrossRef]
13. Xing SC, Huang CB, Mi JD, Wu YB, Liao XD. Bacillus coagulans R11 maintained intestinal villus health and decreased intestinal injury in lead-exposed mice by regulating the intestinal microbiota and influenced the function of faecal microRNAs. Environ Pollut 2019;255:113139. [CrossRef]
14. Carmona-Antoñanzas G, Humble JL, Carmichael SN, Heumann J, Christie HR, Green DM, et al. Time-to-response toxicity analysis as a method for drug susceptibility assessment in salmon lice. Aquaculture 2016;464:570-5. [CrossRef]
15. Dethlefsen L, Eckburg PB, Bik EM, Relman DA. Assembly of the human intestinal microbiota. Trends Ecol Evol 2006;21:517-23. [CrossRef]
16. Sugahara H, Odamaki T, Fukuda S, Kato T, Xiao JZ, Abe F, et al. Probiotic Bifidobacterium longum alters gut luminal metabolism through modification of the gut microbial community. Sci Rep 2015;5:13548. [CrossRef]
17. Ley RE, Bäckhed F, Turnbaugh P, Lozupone CA, Knight RD, et al. Obesity alters gut microbial ecology. Proc Natl Acad Sci U S A 2005;102:11070-5. [CrossRef]
18. Semova I, Carten JD, Stombaugh J, Mackey LC, Knight R, Farber SA, et al. Microbiota regulate intestinal absorption and metabolism of fatty acids in the zebrafish. Cell Host Microbe 2012;12:277-88. [CrossRef]
19. Tremaroli V, Bäckhed F. Functional interactions between the gut microbiota and host metabolism. Nature 2012;489:242-9. [CrossRef]
20. Zarrinpar A, Chaix A, Yooseph S, Panda S. Diet and feeding pattern affect the diurnal dynamics of the gut microbiome. Cell Metab 2014;20:1006-17. [CrossRef]
21. Kohl KD, Weiss RB, Cox J, Dale C, Dearing MD. Gut microbes of mammalian herbivores facilitate intake of plant toxins. Ecol Lett 2014;17:1238-46. [CrossRef]
22. Brown K, DeCoffe D, Molcan E, Gibson DL. Diet-induced dysbiosis of the intestinal microbiota and the effects on immunity and disease. Nutrients 2012;4:1095-119. [CrossRef]
23. Xia JH, Lin G, Fu GH, Wan ZY, Lee M, Wang L, et al. The intestinal microbiome of fish under starvation. BMC Genomics 2014;15:266. [CrossRef]
24. Waite DW, Taylor MW. Characterizing the avian gut microbiota:Membership, driving influences, and potential function. Front Microbiol 2014;5:223. [CrossRef]
25. Dorrestein PC, Gallo RL, Knight R. Microbial skin inhabitants:Friends forever. Cell 2016;165:771-2. [CrossRef]
26. Kearns PJ, Bowen JL, Tlusty MF. The skin microbiome of cow?nose rays (Rhinoptera bonasus) in an aquarium touch?tank exhibit. Zoo Biol 2017;36:226-30. [CrossRef]
27. Lokesh J, Kiron V. Transition from freshwater to seawater reshapes the skin-associated microbiota of Atlantic salmon. Sci Rep 2016;6:19707. [CrossRef]
28. Schommer NN, Gallo RL. Structure and function of the human skin microbiome. Trends Microbiol 2013;21:660-8. [CrossRef]
29. Gallo RL. Human skin is the largest epithelial surface for interaction with microbes. J Invest Dermatol 2017;137:1213-4. [CrossRef]
30. Boutin S, Bernatchez L, Audet C, Derôme N. Network analysis highlights complex interactions between pathogen, host and commensal microbiota. PLoS One 2013;8:e84772. [CrossRef]
31. Sylvain FÉ, Cheaib B, Llewellyn M, Gabriel Correia T, Barros Fagundes D, Luis Val A, et al. pH drop impacts differentially skin and gut microbiota of the Amazonian fish tambaqui (Colossoma macropomum). Sci Rep 2016;6:32032. [CrossRef]
32. Klindworth A, Pruesse E, Schweer T, Peplies J, Quast C, Horn M, et al. Evaluation of general 16S ribosomal RNA gene PCR primers for classical and next-generation sequencing-based diversity studies. Nucleic Acids Res 2013;41:e1. [CrossRef]
33. Rimoldi S, Terova G, Ascione C, Giannico R, Brambilla F. Next generation sequencing for gut microbiome characterization in rainbow trout (Oncorhynchus mykiss) fed animal by-product meals as an alternative to fishmeal protein sources. PLoS One 2018;13:e0193652. [CrossRef]
34. Caporaso JG, Kuczynski J, Stombaugh J, Bittinger K, Bushman FD, Costello EK, et al. QIIME allows analysis of high-throughput community sequencing data. Nat Methods 2010;7:335-6. [CrossRef]
35. Edgar RC. Search and clustering orders of magnitude faster than BLAST. Bioinformatics 2010;26:2460-1. [CrossRef]
36. Lozupone C, Knight R. UniFrac:A new phylogenetic method for comparing microbial communities. Appl Environ Microbiol 2005;71:8228-35. [CrossRef]
37. Lozupone CA, Hamady M, Kelley ST, Knight R. Quantitative and qualitative b diversity measures lead to different insights into factors that structure microbial communities. Appl Environ Microbiol 2007;73:1576-85. [CrossRef]
38. Hammer Ø, Harper DA, Ryan PD. PAST:Paleontological statistics software package for education and data analysis. Palaeontol Electron 2001;4:9.
39. Langille MG, Zaneveld J, Caporaso JG, McDonald D, Knights D, Reyes JA, et al. Predictive functional profiling of microbial communities using 16S rRNA marker gene sequences. Nat Biotechnol 2013;31:814-21. [CrossRef]
40. Wang AR, Ran C, RingøE, Zhou ZG. Progress in fish gastrointestinal microbiota research. Rev Aquacult 2018;10:626-40. [CrossRef]
41. Bates JM, Mittge E, Kuhlman J, Baden KN, Cheesman SE, Guillemin K. Distinct signals from the microbiota promote different aspects of zebrafish gut differentiation. Develop Biol 2006;297:374-86. [CrossRef]
42. Chao Y, Mao Y, Wang Z, Zhang T. Diversity and functions of bacterial community in drinking water biofilms revealed by high-throughput sequencing. Sci Rep 2015;5:10044. [CrossRef]
43. Egerton S, Culloty S, Whooley J, Stanton C, Ross RP. The gut microbiota of marine fish. Front Microbiol 2018;9:873. [CrossRef]
44. Kashinskaya EN, Belkova NL, Izvekova GI, Simonov EP, Andree KB, Glupov VV, et al. A comparative study on microbiota from the intestine of Prussian carp (Carassius gibelio) and their aquatic environmental compartments, using different molecular methods. J Appl Microbiol 2015;119:948-61. [CrossRef]
45. Liu L, Yang J, Yu Z, Wilkinson DM. The biogeography of abundant and rare bacterioplankton in the lakes and reservoirs of China. ISME J 2015;9:2068-77. [CrossRef]
46. Dehler CE, Secombes CJ, Martin SA. Environmental and physiological factors shape the gut microbiota of Atlantic salmon parr (Salmo salar L.). Aquaculture 2017;467:149-57. [CrossRef]
47. Hennersdorf P, Kleinertz S, Theisen S, Abdul-Aziz MA, Mrotzek G, Palm HW, et al. Microbial diversity and parasitic load in tropical fish of different environmental conditions. PLoS One 2016;11:e0151594. [CrossRef]
48. Tarnecki AM, Burgos FA, Ray CL, Arias CR. Fish intestinal microbiome:Diversity and symbiosis unravelled by metagenomics. J Appl Microbiol 2017;123:2-17. [CrossRef]
49. Nguyen NP, Warnow T, Pop M, White B. A perspective on 16S rRNA operational taxonomic unit clustering using sequence similarity. NPJ Biofilms Microbiomes 2016;2:16004. [CrossRef]
50. van Kessel MA, Dutilh BE, Neveling K, Kwint MP, Veltman JA, Flik G, et al. Pyrosequencing of 16S rRNA gene amplicons to study the microbiota in the gastrointestinal tract of carp (Cyprinus carpio L.). AMB Express 2011;1:14. [CrossRef]
51. Roeselers G, Mittge EK, Stephens WZ, Parichy DM, Cavanaugh CM, Guillemin K, et al. Evidence for a core gut microbiota in the zebrafish. ISME J 2011;5:1595-608. [CrossRef]
52. Sullam KE, Essinger SD, Lozupone CA, O'Connor MP, Rosen GL, Knight RO, et al. Environmental and ecological factors that shape the gut bacterial communities of fish:A meta?analysis. Mol Ecol 2012;21:3363-78. [CrossRef]
53. Ye L, Amberg J, Chapman D, Gaikowski M, Liu WT. Fish gut microbiota analysis differentiates physiology and behavior of invasive Asian carp and indigenous American fish. ISME J 2014;8:541-51. [CrossRef]
54. Ingerslev HC, Strube ML, von Gersdorff Jørgensen L, Dalsgaard I, Boye M, Madsen L. Diet type dictates the gut microbiota and the immune response against Yersinia ruckeri in rainbow trout (Oncorhynchus mykiss). Fish Shellfish Immunol 2014;40:624-33. [CrossRef]
55. Ingerslev HC, von Gersdorff Jørgensen L, Strube ML, Larsen N, Dalsgaard I, Boye M, Madsen L. The development of the gut microbiota in rainbow trout (Oncorhynchus mykiss) is affected by first feeding and diet type. Aquaculture 2014;424:24-34. [CrossRef]
56. Larsen AM, Mohammed HH, Arias CR. Characterization of the gut microbiota of three commercially valuable warmwater fish species. J Appl Microbiol 2014;116:1396-404. [CrossRef]
57. Li J, Ni J, Li J, Wang C, Li X, Wu S, et al. Comparative study on gastrointestinal microbiota of eight fish species with different feeding habits. J Appl Microbiol 2014;117:1750-60. [CrossRef]
58. Li XM, Zhu YJ, Yan QY, RingøE, Yang DG. Do the intestinal microbiotas differ between paddlefish (Polyodon spathala) and bighead carp (Aristichthys nobilis) reared in the same pond?J Appl Microbiol 2014;117:1245-52. [CrossRef]
59. Miyake S, Ngugi DK, Stingl U. Diet strongly influences the gut microbiota of surgeonfishes. Mol Ecol 2015;24:656-72. [CrossRef]
60. Ramírez C, Romero J. The microbiome of Seriola lalandi of wild and aquaculture origin reveals differences in composition and potential function. Front Microbiol 2017;8:1844. [CrossRef]
61. Ventura M, Canchaya C, Tauch A, Chandra G, Fitzgerald GF, Chater KF, et al. Genomics of actinobacteria:Tracing the evolutionary history of an ancient phylum. Microbiol Mol Biol Rev 2007;71:495-548. [CrossRef]
62. Wu ZB, Gatesoupe FJ, Li TT, Wang XH, Zhang QQ, Feng DY, et al. Significant improvement of intestinal microbiota of gibel carp (Carassius auratus gibelio) after traditional Chinese medicine feeding. J Appl Microbiol 2018;124:829-41. [CrossRef]
63. Jami M, Ghanbari M, Kneifel W, Domig KJ. Phylogenetic diversity and biological activity of culturable actinobacteria isolated from freshwater fish gut microbiota. Microbiol Res 2015;175:6-15. [CrossRef]
64. Holmfeldt K, Solonenko N, Shah M, Corrier K, Riemann L, VerBerkmoes NC, et al. Twelve previously unknown phage genera are ubiquitous in global oceans. Proc Natl Acad Sci U S A 2013;110:12798-803. [CrossRef]
65. Jammal A, Bariche M, Kambris Z. Characterization of the cultivable gut microflora in wild-caught Mediterranean fish species. Curr Nutr Food Sci 2017;13:147-54. [CrossRef]
66. Shen M, Zheng YG, Shen YC. Isolation and characterization of a novel Arthrobacter nitroguajacolicus ZJUTB06-99, capable of converting acrylonitrile to acrylic acid. Process Biochem 2009;44:781-5. [CrossRef]
67. Zhang X, Zhang G, Yang H. Genomics basis of Arthrobacter spp. Environmental adaptability-a review. Wei Sheng Wu Xue Bao 2016;56:570-7.
68. Kolkenbrock S, Parschat K, Beermann B, Hinz HJ, Fetzner S. N-Acetylanthranilate amidase from Arthrobacter nitroguajacolicus Ru?61a, an a/b-hydrolase-fold protein active towards aryl-acylamides and-esters, and properties of its cysteine-deficient variant. J Bacteriol 2006;188:8430-40. [CrossRef]
69. Gihring TM, Green SJ, Schadt CW. Massively parallel rRNA gene sequencing exacerbates the potential for biased community diversity comparisons due to variable library sizes. Environ Microbiol 2012;14:285-90. [CrossRef]
70. Khan A, Mandal S, Samanta D, Chatterjee S, Ghosh K. Phytase-producing Rhodococcus sp.(MTCC 9508) from fish gut:A preliminary study. Proc Zool Soc 2011;64:29-34. [CrossRef]
71. Sanchez N, Sandoval AH, Diaz-Corrales F, Serrano JA. The genus Rhodococcus. A didactic review. Una revision Rev. Soc. Ven. Microbiol 2004;24:24-33
72. Ponce-Granillo CV, Monroy-Dosta MC, Becerril-Cortés D, Castro-Mejía J, Ocampo-Cervantes JA. Potential use in aquaculture of Rhodococcus sp. (Zopf, 1891). Revista Digital E Bios 2016;1:1-6.
73. Gürtler V, Mayall BC, Seviour R. Can whole genome analysis refine the taxonomy of the genus Rhodococcus?FEMS Microbiol Rev 2004;28:377-403. [CrossRef]
74. Hernández MA, Comba S, Arabolaza A, Gramajo H, Alvarez HM. Overexpression of a phosphatidic acid phosphatase Type 2 leads to an increase in triacylglycerol production in oleaginous Rhodococcus strains. Appl Microbiol Biotechnol 2015;99:2191-207. [CrossRef]
75. Miyazaki K, Sato M, Tsukuda M. PCR primer design for 16S rRNAs for experimental horizontal gene transfer test in Escherichia coli. Front Bioeng Biotechnol 2017;5:14. [CrossRef]
76. Xia X, Zheng D, Zhong H, Qin B, Gurr GM, Vasseur L, Lin H, et al. DNA sequencing reveals the midgut microbiota of diamondback moth, Plutella xylostella (L.) and a possible relationship with insecticide resistance. PLoS One 2013;8:e68852. [CrossRef]
77. Larsen T, Ventura M, Andersen N, O'Brien DM, Piatkowski U, McCarthy MD. Tracing carbon sources through aquatic and terrestrial food webs using amino acid stable isotope fingerprinting. PLoS One 2013;8:e73441. [CrossRef]
78. Etyemez M, Balcázar JL. Bacterial community structure in the intestinal ecosystem of rainbow trout (Oncorhynchus mykiss) as revealed by pyrosequencing-based analysis of 16S rRNA genes. Res Vet Sci 2015;100:8-11. [CrossRef]
79. Kohl J, Ng J, Cachero S, Ciabatti E, Dolan MJ, Sutcliffe B, et al. Ultrafast tissue staining with chemical tags. Proc Natl Acad Sci 2014;111:E3805-14. [CrossRef]
80. Turnbaugh PJ, Ley RE, Mahowald MA, Magrini V, Mardis ER, Gordon JI. An obesity-associated gut microbiome with increased capacity for energy harvest. Nature 2006;444:1027-31. [CrossRef]
81. Turnbaugh PJ, Quince C, Faith JJ, McHardy AC, Yatsunenko T, Niazi F, et al. Organismal, genetic, and transcriptional variation in the deeply sequenced gut microbiomes of identical twins. Proc Natl Acad Sci 2010;107:7503-8. [CrossRef]
82. Han XY, Andrade RA. Brevundimonas diminuta infections and its resistance to fluoroquinolones. J Antimicrob Chemother 2005;55:853-9. [CrossRef]
83. Leys NM, Ryngaert A, Bastiaens L, Verstraete W, Top EM, Springael D. Occurrence and phylogenetic diversity of Sphingomonas strains in soils contaminated with polycyclic aromatic hydrocarbons. Appl Environ Microbiol 2004;70:1944-55. [CrossRef]
84. Glaeser SP, Kämpfer P. The family Sphingomonadaceae. In:The Prokaryotes:Alphaproteobacteria and Betaproteobacteria. Berlin:Springer-Verlag;2014. 641-707. [CrossRef]
85. Silva TP, Paixao SM, Alves L. Ability of Gordonia alkanivorans strain 1B for high added value carotenoids production. RSC Adv 2016;6:58055-63. [CrossRef]
86. Reverter M, Sasal P, Tapissier-Bontemps N, Lecchini D, Suzuki M. Characterisation of the gill mucosal bacterial communities of four butterflyfish species:A reservoir of bacterial diversity in coral reef ecosystems. FEMS Microbiol Ecol 2017;93:fix051. [CrossRef]
87. Cockburn DW, Koropatkin NM. Polysaccharide degradation by the intestinal microbiota and its influence on human health and disease. J Mol Biol 2016;428:3230-52. [CrossRef]
88. Rouf AJ, Phang SM, Ambak MA. Depth distribution and ecological preferences of periphytic algae in Kenyir Lake, the largest tropical reservoir of Malaysia. Chin J Oceanol Limnol 2010;28:856-67. [CrossRef]
89. He R, Zhang D, Lu W, Zheng T, Wan L, Liu F, et al. SLC47A1 gene rs2289669 G>A variants enhance the glucose-lowering effect of metformin via delaying its excretion in Chinese Type 2 diabetes patients. Diabetes Res Clin Pract 2015;109:57-63. [CrossRef]
90. Stephens WZ, Burns AR, Stagaman K, Wong S, Rawls JF, Guillemin K, et al. The composition of the zebrafish intestinal microbial community varies across development. ISME J 2016;10:644-54. [CrossRef]