
1. INTRODUCTION
Rice is the seed of the grass species Oryza sativa L. (Asian rice) or, less commonly, Oryza glaberrima (African rice) [1]. Globally, rice is one of the most frequently spent cereals and food staples for more than semi of the world’s populace [2]. In Malaysia, rice paddy production had been reported to decrease from 2.63 million tonnes to 2.32 million tonnes in 2018–2022 [3]; this led to the decreasing harvested yield from 3.77 hg/ha to 3.59 hg/ha [3]. Even though Malaysia’s rice paddy production fluctuated substantially in recent years, it tended to increase from 1971 to 2020 [4].
In Malaysia, rice is defined as a feature of the culture of Malay, Chinese, and Indian races, with the consumption of the cereal daily either as cooked rice or indirectly in the form of rice flour such as nasi lemak, kuih apam, pulut kuning, and others [5]. No scientific reports are available on the exact number of rice varieties planted in Malaysia, but the categories available include aromatic, white, and brown rice varieties. Rice research in the country mainly focuses on developing rice varieties with better yield, pest resistance, disease resistance, and health benefits through their characteristics [6].
In general, users are becoming more health mindful of the quality of food intake. With most of the Malaysian population consuming rice as a substantial part of their diet, it becomes essential to analyze and monitor its composition. There are countless varieties grown throughout the country, though the nutrient content of wide varieties has not yet been discovered. Therefore, this study aimed to comparatively analyze different rice varieties cultivated in Malaysia: fragrant rice, MRQ 76, local fragrant rice, fragrant brown rice, semi-polished black rice, and semi-polished purple rice. These selected varieties will be through proximate nutrient analysis, such as energy, carbohydrate, protein, fat, moisture, ash, total dietary fiber, saturated fat, and sugar composition.
2. MATERIALS AND METHODS
2.1. Sample Preparation of Rice Varieties
Five different rice varieties were used as selected Malaysian rice for this study: fragrant rice, MRQ 76 (Rice A), local fragrant rice (Rice B), fragrant brown rice, Fragrant Borneo (Rice C), semi-polished black rice, Etem (Rice D), and semi-polished purple rice, Bali Keladi (Rice E). Rice A and Rice B were given by Mutiara Timur Rice Mill SDN BHD for this study. While other rice varieties were collected from different markets available in Kuala Terengganu and Kelantan. A total of 100 g of rice grains of each variety were cautiously separated from any physical residue, set in sealed, labeled containers, and stored at room temperature for the subsequent analyses.
2.2. Nutrient Analysis
Analyses were done by UNIPEQ, Food Quality and Safety Research and Development of Universiti Kebangsaan Malaysia (UKM). All nutrient analyzing was established based on the Association of Official Analytical Chemists (AOAC) methods.
2.3. Moisture and Ash Content
The moisture content was measured using a moisture analyzer machine (Sartorius) [7]. Following the device’s instructions, 5 g of sample were weighed in triplicate and placed in pans. The sample was dried out in the machine, and the percentage moisture of the samples was automatically calculated.
For ash content determination, a total of 5 g of the samples was weighed into the crucible and the samples were dried at 550°C for 24 h in the furnace [8]. The crucible’s Weight was taken over the ash process was completed, and the control was carried out without samples. The ash was expressed as a percentage of the initial fresh sample weight. The percentage was calculated using the following method:
 |
Where, W1 = Weight of sample (g)
W2 = Weight of ash (g)
2.4. Energy (kcal)
The energy content was calculated using Pearson’s method [9].
Energy (kcal) = 4 × g (carbohydrates) + 9 × g (fat) + 4 × g (protein)
2.5. Macronutrients Determination – Carbohydrates, Protein, Fat
The carbohydrate content was calculated based on the method introduced by Pomerancz and Meloan [10].
Carbohydrates = 100 – (proteins + fat + moisture + ash)
For protein, the sample was put into the combustion chamber of a protein analyzer. Then, gas from the combustion was examined for nitrogen content and calculated to protein [11].
Yet, the sample was hydrolyzed with hydrochloric acid and was separated in a liquid-liquid extraction with a mixture of ethyl and petroleum ether solutions for fat determination [12]. The ethers containing the fat were gathered and dried. The subsequently extracted fat was applied to determine the crude fat in the test.
2.6. Macronutrients Determination – Total Dietary Fiber, Sodium, Saturated Fat
The crude fiber was determined using the FOSS Fibertee system, 1020 hot extractors (Foss Food Technology Corp), and crucible-fitted glass [13].
While, the sodium content was determined using in-house methods of Microwave Digestion-Atomic Absorption Spectroscopy introduced by Robinson [14].
The saturated fat in foods was determined using capillary Gas Chromatography-Flame Ionization Detector Animation [15]. The method comprises hydrolytic extraction, methylation, and capillary GC-FID analysis of the resulting fatty acid methyl esters (FAMEs).
2.7. Sugars Composition
The sugar composition consisting of fructose, glucose, sucrose, and maltose was determined using high-performance liquid chromatography (HPLC) with the Refractive Index detector [16]. The samples were prepared by diluting them in water, filtered, and injected directly into the HPLC. The quantitative samples were compared with the standard prepared.
2.8. Quality Control
The subsequent data value for each sample was monitored and examined through internal quality control substances made in the laboratory and certified reference matter. The data were recognized only within the control limits for each nutrient assessed.
2.9. Statistical Analysis
Data were analyzed using descriptive and inferential statistical analysis. The difference of means in samples was accomplished by One-Way ANOVA using SPSS version 20.0 (IBM, Armonk, NY, US). Two-tailed tests were performed with P < 0.05 is a significant difference.
3. RESULTS AND DISCUSSION
The proximate composition or nutrient analysis was studied on selected Malaysian rice varieties and calculated on a dry weight basis. These analyses were investigated to help further understand fat proportion, carbohydrate dilutions, proteins, fiber, sugar, and others. Yet, food nutritional evaluation is an essential condition for food products manufacturing businesses as it is needed to conform to consumer behavior and acceptance thoroughly.
3.1. Proximate Macronutrients Compositions
In this study, the proximate macronutrients of five selected Malaysian rice varieties have been presented. The energy ranges from 354 kcal/100 g to 360 kcal/100 g, carbohydrate ranges from 84.5% to 89%, protein ranges from 7.2% to 9.6%, and total fat ranges from 1.3% to 6.3%, accordingly [Figure 1]. The highest content of energy, carbohydrate, protein, and total fat was observed in Rice D (360 kcal/100 g), Rice A (89%), Rice B (9.6%), and Rice C (6.3%), accordingly [Figure 2]. While, the lowest content of carbohydrates and protein was observed in Rice C (84.5%) and Rice D (7.2%). Then, the lowest energy and total fat content were observed in Rice B with 350 kcal/100 g and 1.3%.
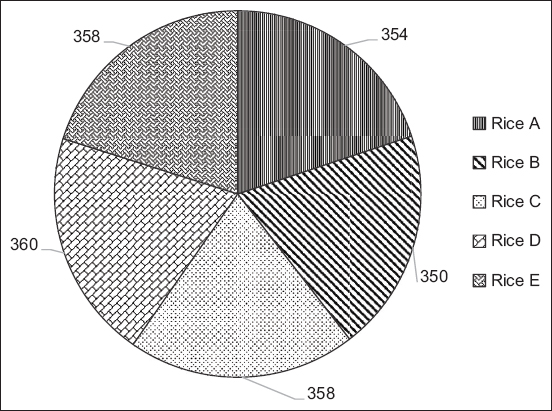 | Figure 1: The energy of selected Malaysian rice varieties (kcal/100 g). [Click here to view] |
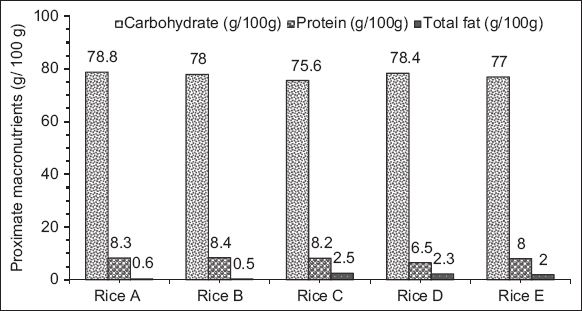 | Figure 2: The proximate macronutrients of selected Malaysian rice varieties (g/100 g). There is no significant difference on One-Way ANOVA test, p>0.05 [Click here to view] |
Corresponding to the FAO, the total energy in brown rice ranges from 363 kcal to 385 kcal, and white rice’s ranges from 349 to 373 kcal [17]. In this study, the energy of brown rice varieties was slightly lower when matched to FAO findings, while fragrant white rice was in the findings. The pattern from the study showed that a variety of brown rice gives higher energy and fat, lower carbohydrate, and protein contrast to other rice. Brown rice is known as whole grain and is formed by removing a hull or husk portion containing the germ and the bran layers [18]; which provides more benefits. White rice is made by polishing brown rice with the removal of bran layers along with the husk or hull [19].
On the other hand, the carbohydrate content, or the extent of starch in the grain, is a crucial reason for deciding grain quality. Starch can differ in the quantity of two starchy sections: amylose with linearly related glucose molecules and amylopectin with glucose molecules branched [20]. The present study noted that the average carbohydrate in brown rice was less than in fragrant white rice; 85.6% compared to 89%. This was supported by Frei and Becker [20], who stated brown rice contains 85% of carbohydrates while white rice has 90%. Comparatively, Singh and Singh [21] observed much fewer carbohydrates in brown and white rice with 71.92% and 74.82%, respectively.
Rice has favorable amino acid components, a high amount of lysine, and protein digestibility, which makes it a good supply of protein in food intake [21]. In the outer part of brown rice, the rice kernel consists of the pericarp layer, aleurone layer, germ layer, and sub-aleurone layer for retaining most of the nutrients such as protein and fat [22]. Meanwhile, the discarded bran of rice in the polishing process to get white rice involved 15% of protein and 85% of fat removal [3,23]. Previously, Qadri et al. [24] and Zahra and Jabeen [25] supported that brown rice contained 1.3% higher protein and 3.7% higher fat than white rice. Contrarily, the average protein found in brown rice is 8.4%, lower than fragrant white rice, with 9.5% in this study, and the lowest value being rice D (7.2%). Following, the average fat found in brown rice is 5.7%, higher than fragrant white rice with 1.4%. For instance, the contradictory value of protein in the study may cause by the origin of the rice variety itself, and this low-protein rice will be beneficial for patients with kidney diseases.
3.2. Proximate Micronutrients Composition
Ash and moisture are the elements in the proximate analysis required for the complete calculation of biological resources. Ash is a non-aqueous deposit that stays after a sample is incinerated and consists mainly of metal oxides [24]. Yet, moisture is water or other liquid dispersed in a small amount as vapor, within a solid or evaporated on a side [25]. In this study, ash and moisture contents were observed in rice varieties, from 0.6 to 1.2 g/100 g for ash and 11.7–12.5 g/100 g for moisture [Table 1] (P < 0.05). Rice C has the highest ash and moisture contents, while Rice A has the lowest ash and moisture contents.
Table 1: The proximate nutrient composition of selected Malaysian rice varieties (g/100 g).
| Nutrition analysis | Types of rice | |||||
|---|---|---|---|---|---|---|
| RICE A | RICE B | RICE C | RICE D | RICE E | P-value | |
| Moisture (g/100 g) | 11.7 | 12.5 | 12.5 | 11.8 | 11.9 | 0.001* |
| Total ash (g/100 g) | 0.6 | 0.6 | 1.2 | 1.0 | 1.1 | |
| Total dietary fiber (g/100 g) | 4.8 | 4.5 | 14.0 | 13.2 | 14.7 | |
| Sodium (mg/100 g) | 1.87 | 9.12 | 2.66 | 1.99 | 2.29 | |
| Saturated fat (g/100 g) | 0.3 | 0.3 | 1.2 | 1.0 | 1.0 | |
| Fructose (g/100 g) | N. D | N. D | N. D | N. D | N. D | - |
| Glucose (g/100 g) | N. D | N. D | N. D | N. D | N. D | |
| Sucrose (g/100 g) | N. D | N. D | N. D | N. D | N. D | |
| Maltose (g/100 g) | N. D | N. D | N. D | N. D | N. D | |
N.D≤0.01 g/100 g, not detected.
* One-Way ANOVA test showed a significant difference, P<0.05.
The ash levels in the study are thought not quite different linked with the Malaysian Food Composition Database in 1997, ranging from 0.5 to 1.0 g/100 g [26] and the USDA (0.64 g/100 g) and Brazil food database (0.54 g/100 g) [23,27]. However, the Malaysian Food Composition Database in 2015 observed a comparable lower ash level ranging from 0.28 to 0.4 g/100 g [28]. The moisture levels in this study also are considered not quite different compared with the Malaysian Food Composition Database in 1997 and 2015, ranging from 11.8–12.7 g/100 g and 12.2–13.21 g/100 g [26,28]; and from the USDA (11.62 g/100 g) and Brazil food database (12.9 g/100 g) [23,27].
In the Malaysian Food Composition Database in 1997, fiber had been reported as total crude fiber, while in the Malaysian Food Composition Database in 2015 [26] and the current studies, fiber is established as total dietary fiber, which consists of insoluble and soluble fiber. The level of total dietary fiber in rice varieties ranged from 4.5 – 4.8 g/100 g for fragrant white rice and 13.2–14.7 g/100 g for brown rice [Table 1]. The higher values of fiber among brown rice varieties were expected as nutritional studies had identified dietary fiber as one of the most healthful components of rice bran [29,30]. In this study, the total dietary fiber among fragrant white rice and brown rice varieties was higher compared to commercial rice in Malaysia (0.63–1.40 g/100 g) [28], USDA white rice (1.3 g/100 g) [23], Brazil white rice (1.8 g/100 g) [27], Bangladesh white rice (1.66 g/100 g) [31], and brown rice (3.32 g/100 g) [32].
This study shows a significant difference in saturated fat between rice varieties (P < 0.05). The saturated fat content has been detected at a low level of 0.3 g/100 g for fragrant white rice varieties and 1.0–1.2 g/100 g for brown rice varieties [Table 1]. Based on Kitta et al. [33], polished or white rice typically comprises a small amount of lipids (below 5% on a dry weight basis) as contrasted with bran or brown rice (about 15% on a dry weight basis), aligned with the current study. It was reported that palmitic acid is a commonly found type of saturated fat and fatty acid in rice other than caproic acid, lauric acid, stearic acid, and others [28,34-36]. The previous studies had detected saturated fat with 1.3 g/100 g in black rice, 0.27 g/100 g in brown rice [34], 0.20 g/100 g in Basmati rice, 0.23 g/100 g in Siamese rice [28], and 0.18 g/100 g and 0.58 g/100 g in USDA white and brown rice [23], accordingly.
As discussed, the extent of polishing significantly impacts the condition and nutritional qualities of white rice, influencing things such as mineral content [37]. It was hypothesized that white rice should have a lower sodium content than brown rice, but the results still depend on the polishing process thoroughly. In this study, the sodium content ranged from 1.87–9.12 mg/100 g, with the highest value in Rice B, a white fragrant rice variety. Yet, the findings have been compared with previous studies with low levels of sodium content ranging from 2.58 – 3.92 mg/100 g for white rice [28], 10.19 mg/100 g in black rice [34], 1.0 mg/100 g for Brazil white rice and 5.0 mg/100 g for USDA white rice [23]. However, Tee et al. [26] reported a high level of sodium content ranging from 9.0–54.0 mg/100 g for white rice in the Malaysian database in 1977. According to the recommended nutrient intake for Malaysians, a sodium requirement of 1500 mg/day is suggested for adults [38]. Therefore, it was suggested that consumers prioritize which rice to consume, especially those who require restricting their intake owing to serious hypertension.
4. CONCLUSIONS
A study conducted on five different rice varieties on selected Malaysian rice indicated comparable nutrient levels except for total sugars (fructose, glucose, sucrose, and maltose), which were not detected. It was observed that Rice D gives the highest calories, Rice C gives the lowest carbohydrate level, and Rice B gives the highest protein and lowest fat levels. Differences were found between ash, moisture, total dietary fiber, sodium, and saturated fat contents among different rice varieties (P < 0.05). Rice varieties’ sodium and saturated fat showed exceptionally low levels. While it was found the highest level of total dietary fiber was analyzed in Rice E. Thus, it was observed that Rice C could represent a reliable source of high dietary fiber, low carbohydrate intake food, and comparable values of other nutrient analysis with the potential use as a healthy option. In addition, the findings could assist consumers with better choice options in estimating the nutrient intake of the variety of rice available.
5. ACKNOWLEDGMENTS
The authors would like to acknowledge Mr. Muhamad Nur Firdaus Nordin from Mutiara Timur Rice Mill SDN BHD and Mr. Mukhlis Mukhtar from Kelantan Agricultural Group Berhad for samples on Rice A and Rice B.
6. AUTHORS’ CONTRIBUTIONS
All authors made substantial contributions to conception and design, acquisition of data, or analysis and interpretation of data; took part in drafting the article or revising it critically for important intellectual content; agreed to submit to the current journal; gave final approval of the version to be published; and agreed to be accountable for all aspects of the work. All the authors are eligible to be an author as per the International Committee of Medical Journal Editors (ICMJE) requirements/guidelines.
7. FUNDING
This study was supported by grant number UniSZA/2022/PPL/KPKB(006) from the Kelantan Agricultural Group Berhad, Indonesia-Malaysia-Thailand Growth Triangle (IMT-GT), and Brunei Darussalam-Indonesia-Malaysia-Philippines East ASEAN Growth Area (BIMP-EAGA).
8. CONFLICTS OF INTEREST
The authors report no financial or any other conflicts of interest in this work.
9. ETHICAL APPROVALS
This study does not involve experiments on animals or human subjects.
10. DATA AVAILABILITY
Data analyses and availability were done by UNIPEQ, Food Quality and Safety Research and Development of Universiti Kebangsaan Malaysia (UKM).
11. PUBLISHER’S NOTE
This journal remains neutral with regard to jurisdictional claims in published institutional affiliation.
REFERENCES
1. Agnoun Y, Biaou SS, Sie M, Vodouhe RS, Ahanchede A. The African rice
2. Makhtar S, Zainal Abidin IS, Islam R. The impact of rice productivity in Malaysia:Econometric analysis. Int J Bus Econ 2022;4:21-32. [CrossRef]
3. Food and Agriculture Organization of the United Nations. Crops and Livestock Products Statistics. Rome, Italy:Food and Agriculture Organization;2022. Available from:https://www.fao.org/faostat/en/. [Last accessed on 2022 Oct 02].
4. World Data Atlas. Malaysia-Rice, Paddy Production Quantity;2022. Available from:https://www.knoema.com/atlas/Malaysia/topics/Agriculture/Crops-Production-Quantity-tonnes/Rice-paddy-production
5. Omar SC, Tumin SA, Shaharudin AA. The status of the paddy and rice industry in Malaysia. Kuala Lumpur:Khazanah Research Institute;2019. 1-200.
6. Hanis A, Nasir M, Shahrim M, Paddy R. Consumers'demand and willingness to pay for rice attributes in Malaysia. Int Food Res J 2012;19:363-9.
7. AOAC Official Method 950.46. Loss on Drying (Moisture) in Meat. Maryland:Association of Official Analytical Chemists;1950. 1.
8. AOAC Official Method 923.03. Ash of Flour, Direct Method. Maryland:Association of Official Analytical Chemists;1923. 1-2.
9. Pearson D. The Chemical Analysis of Foods. 6th ed. London:J and A. Churchill Ltd;1981.
10. Pomeranz Y, Meloan CE. Food Analysis:Theory and Practice. 2nd ed. Washington, USA:Bingo Books 2, Vancouver;2011.
11. AOAC Official Method 991.36. Fat (Crude) in Meat and Meat Products-Solvent Extraction (Submersion) Method. Gaithersburg, MD, USA:AOAC International;1996. 1.
12. AOAC Official Method 991.43. Total, Soluble and Insoluble Dietary Fibre in Foods-Enzymatic Gravimetric Method, MES-TRIS Buffer. Gaithersburg, MD, USA:AOAC International;2000. 1-9.
13. AOAC Official Method 981.10. Crude Protein in Meat, Block Digestion Method. Gaithersburg, MD, USA:AOAC International;1983. 1-2.
14. Robinson JW. Determination of sodium by atomic absorption spectroscopy. Anal Chim Acta 1960;23:458-61. [CrossRef]
15. AOAC Official Method 996.06. Fat (Total, Saturated and Unsaturated in Foods-Hydrolytic Extraction Gas Chromatographic) Method. Gaithersburg, MD, USA:AOAC International;2010. 1-6.
16. AOAC Official Method 982.14. Glucose, Fructose, Sucrose, and Maltose in pre-Sweetened Cereals-Liquid Chromatography Method. Gaithersburg, MD, USA:AOAC International;1983. 1-2.
17. Bienvenido OJ. Rice in human nutrition. 1st ed. Rome;FAOSTAT;1993.
18. Bergman CJ. Rice End-Use Quality Analysis-in Rice:Chemistry and Technology. Washington, DC:American Association for Clinical Chemistry International Press;2019. 273-337. [CrossRef]
19. Sun QD, Spiegelman RM, van Dam Holmes MD, Malik VS, Willett WC, Hu FB. White rice, brown rice, and risk of Type 2 diabetes in US men and women. Arch Intern Med 2010;170:961-9. [CrossRef]
20. Frei M, Becker K. On Rice, Biodiversity, and Nutrients. Germany:Department of Aquaculture Systems and Animal Nutrition, University of Hohenheim;2005. 1-20.
21. Singh N, Singh D. The nutritional composition of local rice varieties in Guyana. Greener J Agric Sci 2019;9:138-45. [CrossRef]
22. Sharif MK, Butt MS, Anjum FM, Khan SH. Rice bran:A novel functional ingredient. Crit Rev Food Sci Nutr 2014;54:807-16. [CrossRef]
23. United States Department of Agriculture (USDA). National Nutrition Database for Standard Reference, Release 25;2012. Available from:https://data.nal.usda.gov/dataset/usda-national-nutrient-database-standard-reference-legacy-release. [Last accessed on 2022 Oct 03].
24. Qadri T, Fatima T, Beenish B, Gani G, Ayaz Q. Brown rice:Nutrition and health claims. Int J Multidiscip Res Dev 2018;5:5-8.
25. Zahra N, Jabeen S. Brown rice as useful nutritional source. Pak J Agric Res 2020;33:445-53. [CrossRef]
26. Tee ES, Noor MI, Azudin MN, Idris KI. Nutrient Composition of Malaysian Foods. 4th ed. Kuala Lumpur, Malaysia:Institute for Medical Research;1997.
27. Padovani RM, Lima DM, Colugnati FA, Rodriguez-Amaya DB. Comparison of proximate, mineral and vitamin composition of common Brazilian and US foods. J Food Compost Anal 2007;20:733-8. [CrossRef]
28. Fairulnizal MN, Norhayati MK, Zaiton A, Norliza AH, Rusidah S, Azwir AR,
29. Cho DH, Lim ST. Germinated brown rice and its bio-functional compounds. Food Chem 2016;196:259-71. [CrossRef]
30. Okarter N, Liu RH. Health benefits of whole grain phytochemicals. Crit Rev Food Sci Nutr 2010;50:193-208. [CrossRef]
31. Sarker BC, Roy SR. Proximate composition, and nutritional values of grain of four aromatic and two non-aromatic rice cultivars in Bangladesh. Int J Agric Med Plant 2021;2:10-5.
32. Babu PD, Subhasree RS, Bhakyaraj R, Vidhyalakshmi R. Brown rice-beyond the colour reviving a lost health food-a review. Am Eurasian J Agron 2009;2:67-72.
33. Kitta K, Ebihara M, Lizuka T, Yoshikawa R, Isshiki K, Kawamoto S. Variations in lipid content and fatty acid composition of major non-glutinous rice cultivars in Japan. J Food Compost Anal 2005;18:116-22. [CrossRef]
34. Thomas R, Rajeev B, Kuang YT. Composition of amino acids, fatty acids, minerals, and dietary fibre in some of the local and import rice varieties of Malaysia. Int Food Res J 2015;22:1148-55.
35. Cho KS, Kim HJ, Lee JH, Kang HH, Lee YS. Determination of fatty acid composition in 120 Korean native rice cultivars. HortScience 2006;41:1082. [CrossRef]
36. Hwang YH, Jang YS, Kim MK, Lee HS. Fatty acid composition of rice bran oil and growth-promoting effect of rice bran extract and rice bran oil on
37. Liang H, Li Z, Tsuji K, Nakano K, Nout MR, Hamer RJ. Milling characteristics and distribution of phytic acid and zinc in long, medium, and short grain rice. J Cereal Sci 2008;48:83-91. [CrossRef]
38. Recommended Nutrient Intake (RNI) for Malaysia 2017. A report of the technical working group on nutritional guidelines. In:National Coordinating Committee on Food and Nutrition. Malaysia:Ministry of Health Malaysia;2017.