
1. INTRODUCTION
Anthropogenic activities and natural calamities tend to influence and degrade water resources across the globe [1]. Water from the Ganga River is used for several activities such as sustenance, agriculture, and industries [2]. Many cities and towns situated on the banks of the Ganga influence water quality, as wastes are often directly discharged into the river. Even when treatment plants are present, their efficiency is limited. In the Ganga basin, around 12,000 million L/day (MLD) of sewage is generated, while the treatment capacity is only about 5,000 MLD [3]. The contributions from municipal sewage and industrial effluents are approximately 70–80% and 15–20%, respectively [4-6]. In Kanpur city, which is one of the major urban and industrial centers along the Ganga, municipal solid waste generation has been estimated at approximately 1,400–1,500 tonnes/day [7], further exacerbating the pollution burden in this stretch of the river. These xenobiotics, especially heavy metals, influence aquatic life by disrupting physiological processes. There are several reports on parameters such as temperature, dissolved oxygen (DO), total dissolved solids (TDS), pH, and conductivity influencing fish health [8,9], supporting the use of fish as bioindicators of water bodies. This is primarily due to the bioaccumulation of heavy metals in fish tissues, as they are non-biodegradable entities. Presence of trace and heavy metals in different tissues of fish has been observed by several workers [10,11]. The metals tend to influence several health conditions in fishes; however, this study intends to observe the effect on molecular, physiological, and biochemical responses in brooders. Bioindices such as hepatosomatic index (HSI), gonadosomatic index (GSI), and condition factor (K) are used for studying metabolic activities, reproductive and general health of fishes.
Heavy metals can affect various physiological and biochemical pathways, including those involving antioxidant enzymes [12]. In fish, enzymes such as superoxide dismutase (SOD), catalase (CAT), and glutathione peroxidase (GPx) play a crucial role in maintaining normal cellular function by catalyzing reactions involving oxygen (O2)-derived metabolites. SOD catalyzes the conversion of superoxide radicals into hydrogen peroxide (H2O2) and molecular O2, while CAT facilitates the breakdown of H2O2 into water and O2. GPx complements the actions of SOD and CAT by reducing H2O2 and organic hydroperoxides to water and alcohol, respectively. GPx utilizes reduced glutathione (GSH) as a co-substrate, converting it to oxidized glutathione (GSSG) in the process. GPx activity in fish can be affected by environmental factors, including the availability of selenium, which is essential for proper enzyme function [13].
Metallothionein’s (MTs), low-molecular-weight, cysteine-rich proteins, play a fundamental role in metal homeostasis, detoxification, and antioxidant defense in fish [14]. MTs are frequently utilized as biomarkers for aquatic habitats polluted by heavy metals due to their strong affinity to metal ions [15]. The induction of MT synthesis in response to metal exposure is a well-documented defense mechanism in fish.
In addition to these biochemical markers, reproductive hormones play a pivotal role in assessing the reproductive health of fish under environmental stress. Testosterone, a key male reproductive hormone, is essential for spermatogenesis by promoting the proliferation and maturation of spermatogonia while sustaining normal testicular physiology [16]. Estradiol (17β-estradiol, E2), the most biologically active estrogen in fish, is critical for female reproductive function, promoting oocyte growth, ovarian follicle formation, and vitellogenesis [17]. Disruption in hormonal balance, particularly due to heavy metal exposure, can severely impair reproductive performance in fish populations. Vitellogenesis is the process by which the liver synthesizes vitellogenin (Vtg) under the stimulation of estrogen, and it is subsequently released into the bloodstream, transported to developing oocytes, and taken up via receptor-mediated endocytosis, where it forms the major yolk protein for embryo development [18]. Among various estrogen receptors in fish, estrogen receptor alpha (ERα) is considered the key mediator of estrogen action in Vtg synthesis. Its expression increases significantly during the breeding season and is strongly induced by exogenous estrogen treatment [19,20]. Typically, Vtg expression is upregulated only in adult females during gonadal maturation. However, the induction of Vtg and ERα in males is a strong indicator of estrogenic or heavy metal contamination, as these genes are not normally or minimally expressed in male fish [21,22]. Heavy metals can mimic estrogenic compounds, leading to the expression of these genes, making them reliable molecular biomarkers of endocrine disruption.
Channa striata, an indigenous species, was selected for this study due to its ecological significance and sensitivity to environmental changes. As a top predator in freshwater ecosystems, C. striata occupies a higher trophic level, making it more susceptible to biomagnification of toxicants, including heavy metals. In addition, C. striata exhibits more pronounced physiological responses to environmental stress, making it a more effective bioindicator [23]. The Ganga stretch at Kanpur and Narora offers a natural pollution gradient, allowing comparative assessment of heavy metal-induced physiological and biochemical alterations.
Previous studies have reported heavy metal pollution in the Ganga River and its effects on various physiological functions in fish [24,25]. However, there is limited understanding of how these metals affect endocrine function and molecular biomarkers in a sex-specific manner. So far, no comprehensive study has investigated Vtg and ERα expression in both males and females alongside hormonal profiling (testosterone, estradiol) across two stretches of the Ganga with varying pollution gradients. Therefore, it is hypothesized that heavy metal contamination in the Ganga leads to bioaccumulation in C. striata, thereby altering bioindices, antioxidant enzyme activities, MT levels, and inducing endocrine disruption that compromises reproductive health.
2. MATERIALS AND METHODS
2.1. Sample Collection and Analysis of Water Samples
Samples were collected from the Ganga River at Narora (28° 11′ 20.0” N 78° 23′ 48.0” E) and Kanpur (26° 26′ 14.4” N 80° 24′ 12.6” E) during the monsoon season. Sites were selected based on various sources of pollution. Being an industrial center, Kanpur receives a large amount of untreated wastewater from textile mills, tanneries, and other industries. Narora is a relatively less industrialized region, although agricultural activities are prevalent. KGF Hatchery (27° 49′ 22.1” N 77° 56′ 50.8” E) was selected as a reference site, which is an important aquaculture facility contributing to fish breeding and seed production.
A total of 60 fishes were collected across all study sites using drag nets. After capture, the live fishes were carefully transported to the laboratory and acclimatized for several hours to reduce stress before further experimental processing.
2.1.1. Analysis of physicochemical parameters and heavy metal estimation of water samples
TDS, conductivity, and pH were measured using electronic meters (HANNA), while transparency was measured on the spot by Secchi disk. Temperature was measured using a thermometer (Deluxe, 6). Water was fixed at the spot and brought to the laboratory to determine DO by the Winkler iodometric method [26]. Heavy metals, including Cu, Fe, Ni, Cr, Cd, and Pb, were estimated in water as per the standard protocol of APHA [27] using an Atomic Absorption spectrophotometer (AAS, AAS PinAAcle 900F, Perkin Elmer).
2.2. Heavy Metal Estimation in Fish Tissues
Ten specimens were collected from each site and dissected in the laboratory for heavy metal estimation in the liver, gonads, and muscle tissues. No disinfectants were used during dissection, as the aim was to study the tissues under natural environmental conditions without introducing chemical alterations. A total of 60 fish (n = 60) were collected across all study sites. From each site, 20 fishes were collected, including 10 males and 10 females (n = 10). The tissues were oven-dried at 55–60°C for 5–6 h and powdered using a mortar and pestle. A 2-gram sample from each powdered tissue was digested with HNO3 and HClO4 in a 4:1 ratio in borosilicate beakers. The beakers were placed on a hot plate at 40–45°C until a clear, transparent solution was obtained, cooled, and filtered to remove any undissolved impurities. The digested samples were then brought to a final volume of 50 ml using volumetric flasks and mixed thoroughly for heavy metal estimation. The concentrations of Cu, Fe, Ni, Cr, Cd, and Pb in tissues were determined using an atomic absorption spectrophotometer (AAS PinAAcle 900 F) following the standard protocol of APHA [27].
2.3. Bioindices Measurement
The total length of fish was measured using a stainless-steel ruler, and its weight was measured using a weighing balance (KERRO BL-P3/5002). The length and weight of the captured fish were recorded. They were euthanized by pithing to dissect the liver and gonads to calculate bioindices such as HSI, condition factor (K), and GSI as proposed by Desai [28] using the formulae:
HSI = Weight of the liver (g)/total fish weight (g) × 100
K = Total fish weight (g)/length3 (cm) × 100
GSI = Weight of the gonads (g)/total fish weight (g) × 100
2.4. Biochemical Assays
2.4.1. Homogenate preparation
Fragments of gonads and liver were stored at −80°C until homogenization. For MT content analysis, tissue samples were homogenized in Tris-HCl/saccharide buffer (20 mM/500 mM, pH 8.6), and for the analysis of other biochemical biomarkers, gonadal and hepatic tissue were homogenized in potassium phosphate buffer (0.1 M, pH 7.0). After homogenization, samples were centrifuged at 15,000 × g for 30 min at 4°C. Aliquots of the supernatant for each biomarker were stored at −80°C.
2.4.2. Antioxidant enzyme activities
2.4.2.1. Estimation of SOD
SOD activity was assayed according to the protocol of McCord and Fridovich [29]. During the measurement process, the reaction mixture (3 mL) consisted of sodium phosphate buffer (50 mmol/L, pH 7.8), methionine (13 mmol/L), nitroblue tetrazolium (75 μmol/L), riboflavin (2 μmol/L), and 50 μL of the tissue supernatant. The reaction mixture was incubated for 15 min in fluorescent light under conditions of 25°C. Meanwhile, a UV/Vis spectrophotometer (UV-Helios 5 ALPHA MODEL) was used to measure the absorbance at 560 nm. Non-illuminated mixtures without enzyme extract were treated as control. The enzyme volume that corresponded with 50% inhibition of the reaction was estimated.
A blank was first prepared under fluorescent light without tissue supernatant, and the percent inhibition of the reaction was calculated using the formula:
Percent inhibition = ([Absorbance of control – Absorbance of sample]/Absorbance of control) × 100
The enzyme volume that produced 50% inhibition of the superoxide-driven reaction was identified based on this calculation. One unit (U) of SOD activity was defined as the amount of enzyme required to cause 50% inhibition of the reaction under the assay conditions. The final enzyme activity was normalized to the total protein content and expressed as U/mg protein.
2.4.2.2. Estimation of CAT
CAT activity was estimated following the method of Lushchak and Bagnyukova [30]. The reaction mixture consisted of 50 mM potassium phosphate (KPi) buffer (pH 7.0), 0.5 mM EDTA, 10 mM H2O2, and 5–50 μL of tissue supernatant. CAT activity was measured at 240 nm using a UV–visible spectrophotometer (UV-Helios 5 Alpha model).
2.4.2.3. Estimation of GPx
GPx activity was determined following the method of Paglia and Valentine [31]. Briefly, a reaction solution was prepared in 20 mL of phosphate buffer (100 mM; pH 7.0) containing EDTA 5 mM, 3.12 g of NADPH, 10 μL of glutathione reductase (500 U/mg of protein/mL), 250 μL of NaN3 100 mM, and 7.68 g of reduced glutathione. Then, 510 μL of the reaction solution, 30 μL of milli-Q water, and 30 μL of tissue supernatant were added to the optical cell. The enzymatic reaction was initiated with the addition of 60 μL of 4 mM H2O2. The decrease in absorbance due to NADPH oxidation to NADP+ was monitored at 340 nm for 5 min using a UV–visible spectrophotometer (UV-Helios 5 Alpha model).
2.4.3. MT concentration
The concentration of MT protein in liver and gonads was analyzed by the method of Viarengo et al. [32] using ethanol, chloroform, HCl, Tris-HCl buffer (20 mM), NaCl (0.25 M), sodium EDTA (4 mM EDTA and 1.0 M HCl), and Ellman’s solution (DTNB; Methanol, and 0.2 M sodium phosphate buffer saturated with 2.0 M NaCl). The concentration of reduced sulfhydryl was estimated with a UV spectrophotometer (UV-Helios 5 Alpha model) by taking the absorbance at 412 nm. For quantification, a standard calibration curve was prepared using reduced glutathione (GSH) in the concentration range of 0–500 μg/mL. The standard curve exhibited high linearity, with a coefficient of determination (R2 = 0.9933), indicating strong reliability of the assay. The concentration of MT in the samples was calculated using GSH as a standard, considering that 20 mol of cysteine is present in 1 mol of MT.
2.5. Hormonal Assay
The size of C. striata used in the study ranged from 32.0 to 36.7 cm across different sampling sites, and approximately 1.5–2.5 mL of blood was collected from each specimen. Blood was drawn from the caudal vein of live fish using a syringe and allowed to rest at room temperature for 1 h. The samples were then centrifuged (Agile, CentriteQ) at 1,000–2,000 × g for 10 min to obtain the serum, which was immediately transferred to a clean polypropylene tube using a Pasteur pipette. Hormonal analysis (testosterone and estradiol) was carried out using the Elecsys kit (Roche Diagnostics Ltd., India).
2.6. Genotoxicity Studies
Total RNA from liver was extracted using Trizol (Sigma) by vigorously shaking it and centrifuging in acidic conditions. The upper aqueous phase was collected, treated with an equal volume of isopropyl alcohol, and incubated at −20°C for 30 min. The mixture was then centrifuged at 10,000 RPM at 4°C for 10 min. After centrifugation, the supernatant was discarded and the collected pellet was dried, and then nuclease-free water was added to it [33]. The obtained RNA integrity was checked using agarose gel electrophoresis. For gel preparation, 1 g of agarose was added to 100 mL of 1X TAE (Tris-Acetate EDTA) buffer to prepare a 1% agarose gel. Out of this, 50 mL of molten gel was poured into a casting tray (Medox Biotech India Pvt. Ltd.) containing 2 μL of ethidium bromide and allowed to solidify for 20 min with a comb in place. After solidification, 2 μL of 6X DNA loading dye and 10 μL of RNA sample were loaded into each well. Electrophoresis was carried out at 110 V for 45–60 min, and the bands were visualized under UV light. The Orcinol method was used for quantification of RNA [34]. dT column was used for the isolation of mRNA. For cDNA synthesis by reverse transcription, 4ug of each sample was used using RevertAid™ First Strand cDNA Synthesis Kit (Thermo Scientific, Cat. No. K1621) in a thermocycler (MWG Biotech). The synthesized cDNA was used for quantification of Vtg, ERα, and the β-actin genes using real time quantitative PCR (RT-qPCR, AB-Applied Biosystem, 7000 system software). The primers (forward and reverse) were designed using Primer Express 3.0, as indicated in Table 1. Melting curve analysis was performed over a range of 45–95°C to study the target amplification specificity. 7000 System Software was used to obtain threshold cycle (Ct) values. Corresponding Ct values of β-actin were used to normalize each Ct value of the target gene. The 2-??Ct method was used to determine the relative expression levels of target genes [35].
Table 1: Forward and reverse primer sequences used for RT-qPCR analysis.
| Gene | Forward | Reverse | Product bps | Accession Number |
|---|---|---|---|---|
| Β-actin | GGTATGTGCAAGCCGGATTC | CCAGATCTTCTCCATGTCATC | 173 | JF423931 |
| ERα | GGATGGGAGGAAACAGTAG | TCTCATCCGTGTTGGTCAGC | 197 | GU969584.1 |
| Vtg | TATGAGGCGTTGCTCCTTGG | CCAGGGCTAAAGTCAACTTG | 202 | MK112905.1 |
2.7. Ethical Statement
All the experiments adhered to the guidelines prescribed by the Ministry of Environment and Forests, Government of India, under registration no. CPCSEA/BC/P-8/2023-24 issued by the Committee for Control and Supervision of Experiments on Animals, New Delhi, and approved by the Institutional Animal Ethical Committee, Department of Biochemistry, Aligarh Muslim University, Aligarh, India.
2.8. Statistical Analysis
In the present study, each experiment was conducted with three independent replicates (n = 3), and each replicate included samples from ten individuals (n = 10). Before analysis, data were tested for normality using the Shapiro–Wilk test and for homogeneity of variance using Levene’s test. Statistical comparisons among different sites were performed using one-way analysis of variance (ANOVA) followed by Tukey’s post hoc test. In addition, for parameters in which male and female data were presented together (antioxidant enzyme activities and gene expression profiles), a two-way ANOVA, followed by Tukey’s post hoc test, was applied. Pearson’s correlation coefficient (r) was used to assess the relationship between heavy metal concentrations and MT levels across different tissues. All statistical analyses were carried out using GraphPad Prism software (version 8.4.3.686), and the results were expressed as mean ± standard deviation (SD). Differences were considered statistically significant at P < 0.05.
3. RESULTS
3.1. Physicochemical Parameters and Heavy Metal Analysis at Selected Sites
3.1.1. Physicochemical parameters of water
The physicochemical parameters of the water samples from the three study sites, KGF Pond (reference site), Ganga River at Narora, and Kanpur (Jajmau), differed significantly (P < 0.05), as summarized in Table 2.
Table 2: Description of physicochemical properties of the study sites and heavy metal concentration of the water samples.
| Parameters | KGF Pond, Aligarh* | Ganga River Narora | Ganga River, Kanpur (Jajmau) | Ideal Conditions (CPCB, 2019) & (WHO 2004/USEPA, (Metals) |
|---|---|---|---|---|
| Temperature (°C) | 26.5±0.95c | 28.5±1.32b | 30.73±0.66a | 20-30 |
| Dissolved oxygen (mg/L) | 7.67±0.52a | 5.58±0.25b | 3.38±0.45c | >6.0 |
| Total dissolved solids (mg/L) | 168±11.13c | 482.33±10b | 585±17a | 500 |
| pH | 7.9±0.2a | 7.2±0.26b | 6.16±0.30c | 6.5-8.5 |
| Conductivity (μS/cm) | 72±5.29c | 322.66±4.04b | 504±8a | 1000 |
| Transparency (m) | 0.533±0.02a | 0.36±0.03b | 0.3±0.02c | 1.5-3.5 |
| Cd | Bdl | 0.235±0.004b | 0.376±0.003a | 0.003 mg/L |
| Ni | Bdl | 0.383±0.003a | 0.304±0.004b | 0.02 mg/L |
| Cu | Bdl | 0.103±0.001b | 0.185±0.003a | 2/1.3 mg/L |
| Cr | Bdl | 0.369±0.002b | 0.711±0.002a | 0.05/0.1 mg/L |
| Fe | 0.185±0.001c | 1.554±0.026b | 2.666±0.012a | 0.3-1.0 mg/L |
| Pb | Bdl | 0.182±0.002b | 0.404±0.003a | 0.05 mg/L |
Values given as mean±SD. ANOVA was used to test the significance of means. Means with different superscripts in a row indicates a significant difference set at a significance level of P<0.05. Guidelines from CPCB: Central Pollution Control Board, 2019, and heavy metal permissible limits by WHO, 2004 and USEPA). ? Indicates reference site. Bdl: below detection limit
Water temperature remained within the ideal range (20–30°C) at KGF and Narora (26.5°C and 28.5°C, respectively), except at Kanpur, which showed an increase in temperature above the ideal range. Water at KGF had an ideal amount of DO (7.67 mg/L), which declined at Narora (5.58 mg/L) and Kanpur (3.38 mg/L). Desired (168 mg/L) TDS values were observed at the reference site, while higher values at Narora (482.33 mg/L) and Kanpur (585 mg/L) surpassed the permissible threshold. Water at KGF was slightly alkaline (7.9), while Narora had a slightly lower but acceptable pH of 7.2. In contrast, the pH (6.16) at Kanpur was acidic. EC at all the sites was within the acceptable range (100–1000 μS/cm). Water transparency was below ideal values at all the sites.
3.1.2. Heavy metal concentration in water
Heavy metal analysis across the three study sites revealed a significant (P < 0.05) increase in pollution levels at the Ganga River, with KGF Pond (reference site) showing minimal pollution [Table 2]. At KGF Pond, only Fe was detected at a concentration of 0.185 mg/L, within the permissible range (0.3–1.0 mg/L), indicating an uncontaminated environment. In contrast, heavy metals at both sites, except Cu, exceeded the recommended limits. The order of heavy metal concentration at Narora was Fe > Ni > Cr > Cd > Pb > Cu, while at Kanpur, it was Fe > Cr > Pb > Cd > Ni > Cu.
3.2. Heavy Metal Bioaccumulation in the Tissues
The analysis of heavy metal accumulation in both brooders collected from Kanpur and Narora revealed significant (P < 0.05) differences in the levels of Cu, Fe, Ni, Cr, Cd, and Pb across different tissues and sites, with Kanpur showing mostly higher levels due to greater industrial activities, particularly tanneries.
As depicted in Tables 3 and 4, heavy metal accumulation in different tissues of both male and female brooders is presented. The order of accumulation was similar in both sexes, showing the highest bioaccumulation in the liver, followed by the testes, with muscles displaying the lowest concentrations. In males, Pb bioaccumulated more in muscles than in testes. The order of heavy metal accumulation in the liver at Kanpur was Fe > Cu > Cr > Ni > Pb > Cd. At Narora, a similar trend was observed in the liver, except for Ni, which exceeded Cr levels. In the testes, the bioaccumulation sequence at Kanpur was Fe > Cr > Cu > Ni> Cd> Pb, while a different order was observed at Narora, where the pattern was Fe > Ni > Cu > Cd> Cr > Pb. Muscle tissues at both sites contained metal concentrations exceeding the permissible limits established by FAO and WHO. The bioaccumulation pattern in muscle tissue at Kanpur was Fe > Cr > Cu > Pb> Ni > Cd, whereas at Narora, the pattern followed the order was Fe > Cu > Ni > Cr > Pb > Cd. In females, the pattern of bioaccumulation in the liver at Kanpur followed the order Fe > Cu > Pb> Ni > Cr > Cd, whereas the bioaccumulation at Narora sites was Fe > Cr > Cu > Ni> Pb> Cd. In contrast, the bioaccumulation patterns in the ovaries differed from those in the testes, where concentrations and the order of accumulation were Fe > Ni > Cu > Pb > Cd > Cr. In addition, muscle tissue exhibited varying accumulation patterns at both sites in females, with higher concentrations of heavy metals recorded at Kanpur, except for Ni. The accumulation order for muscle tissue is Fe > Cu > Cd > Cr > Ni > Pb at Kanpur, whereas at Narora, it is Fe > Ni > Pb > Cd> Cr> Cu. Notably, heavy metal concentrations in muscle tissues exceeded the permissible limits established by the FAO and WHO.
Table 3: Bioaccumulation of heavy metals (Cu, Fe, Ni, Cr, Cd & Pb) in different tissues (liver, testes and muscle) of male across the study sites.
| Organ | Sites | Cu | Fe | Ni | Cr | Cd | Pb |
|---|---|---|---|---|---|---|---|
| KGF* | bdl | 40.35±0.49c | bdl | bdl | bdl | bdl | |
| Liver | Narora | B60.74±1.03b | A150.76±0.67b | C40.39±0.97b | D33.22±0.59b | F26.41±0.56b | E32.78±1.57b |
| Kanpur | B66.3±0.94ª | A166.63±1.23ª | D42.01±0.78ª | C47.74±0.92ª | F29.04±0.67ª | E39.07±1.53ª | |
| KGF* | bdl | 25.26±0.62c | bdl | bdl | bdl | bdl | |
| Testes | Narora | C18.33±0.49b | A46.37±1.08b | B23.03±0.76ª | D16.51±0.58b | CD17.42±0.52b | E9.39±0.82b |
| Kanpur | B22.14±1.19ª | A50.89±1.75ª | BC21.36±1.29b | B23.02±1.73ª | C20.68±1.02ª | D15.22±0.53ª | |
| KGF* | bdl | 3.24±0.36c | bdl | bdl | bdl | bdl | |
| Muscles | Narora | B18.22±0.45b | A38.05±0.78b | C17.35±0.53ª | D13.35±0.48b | E11.21±0.46b | D13.28±0.49b |
| Kanpur | C20.31±0.75ª | A47.0±1.19ª | D16.09±1.05b | B24.54±1.16ª | D15.44±0.70ª | C19.22±0.81ª | |
| FAO | 10 | 5.6 | 0.5-0.6 | 1 | 1 | 0.05 |
Values given as mean±SD. ANOVA was used to test the significance of means. The different superscripts (capital, row: HM accumulation in a tissue) (small column: HM accumulation comparing the sites) indicate a statistically significant difference set at a significance level of P<0.05. * Indicates the reference site, and bdl is below the detection limit. Concentration of heavy metals is in mg/Kg dw
Table 4: Bioaccumulation of heavy metals (Cu, Fe, Ni, Cr, Cd & Pb) in different tissues (liver, ovaries and muscle) of female across the study sites.
| Organ | Sites | Cu | Fe | Ni | Cr | Cd | Pb |
|---|---|---|---|---|---|---|---|
| KGF* | bdl | 46.01±0.13c | bdl | bdl | bdl | bdl | |
| Liver | Narora | BC40.21±1.44b | A153.21±3.14b | C39.64±0.98ª | B41.07±0.82ª | E21.35±1.46b | D30.82±0.74b |
| Kanpur | B53.30±0.77ª | A170.67±1.1ª | D35.26±0.75b | E30.33±0.50b | F25.19±1.12ª | C37.01±0.8ª | |
| KGF* | bdl | 33.21±1.21c | bdl | bdl | bdl | bdl | |
| Ovaries | Narora | CD19.84±0.90b | A54.36±0.90b | B29.33±1.17b | F16.79±1.16b | E18.19±1.24b | DE19.31±1.17b |
| Kanpur | C28.67±0.49ª | A66.41±0.94ª | B33.67±0.41ª | F23.54±0.46ª | E24.04±0.80ª | DE24.31±0.72ª | |
| KGF* | bdl | 1.31±0.23c | bdl | bdl | bdl | bdl | |
| Muscles | Narora | F10.80±1.09b | A32.44±1.37b | B22.38±0.83ª | E12.25±0.92b | D14.31±0.93b | C17.30±1.49ª |
| Kanpur | B21.73±0.49ª | A41.49±0.58ª | D11.76±0.50b | C16.96±1.00ª | B20.62±0.69ª | D10.60±0.58b | |
| FAO | 10 | 5.6 | 0.5-0.6 | 1 | 1 | 0.05 |
Values given as mean±SD. ANOVA was used to test the significance of means. The different superscripts (capital, row: HM accumulation in a tissue) (small column: HM accumulation comparing the sites) indicate a statistically significant difference set at a significance level of P<0.05.
* Indicates the reference site, and bdl is below the detection limit. Concentration of heavy metals is in mg/Kg dw
3.3. Effect of Heavy Metals on Bioindices
Heavy metals had a significant effect on both males’ and females’ bioindices, which are summarized in Table 5. Comparative analysis across gender and sites indicated that female brooders significantly exhibited higher GSI, demonstrating increased reproductive investment. Among sites, the highest GSI values were observed at KGF, while Kanpur recorded considerably lower GSI values for both genders. On comparing HSI across sites and genders, males displayed the highest HSI values, especially at Kanpur. The condition factor (K), which measures general health and robustness, was higher in females than males across all sites. This is consistent with their larger gonads and greater investment in reproduction, which increases the body condition factor.
Table 5: Bio indices in male and female across the sites.
| Gender | Sites | Gonadosomatic index (GSI) | Hepatosomatic index (HSI) | Condition factor (K) |
|---|---|---|---|---|
| KGF* | 0.292±0.001ª | 1.122±0.002c | 1.025±0.003ª | |
| Male | Narora | 0.238±0.002b | 1.138±0.002b | 0.933±0.002b |
| Kanpur | 0.212±0.003c | 1.17±0.007ª | 0.784±0.003c | |
| KGF* | 5.95±0.025ª | 0.959±0.006ª | 1.124±0.011ª | |
| Female | Narora | 5.35±0.042b | 0.863±0.003b | 1.009±0.012b |
| Kanpur | 4.75±0.048c | 0.779±0.007c | 0.937±0.003c |
Values given as mean±SD. ANOVA was used to test the significance of means. The different superscripts in a column indicate a statistically significant difference set at a significance level of P<0.05 across three sites.
* Indicates reference site
3.4. Effect of Heavy Metals on Antioxidant Enzyme Activities in Liver and Gonads
The effect of heavy metals on antioxidant enzymes (SOD, CAT, and GPx) in the liver and gonads of male and female brooders is depicted in Figures 1 and 2, analyzed using two-way ANOVA.
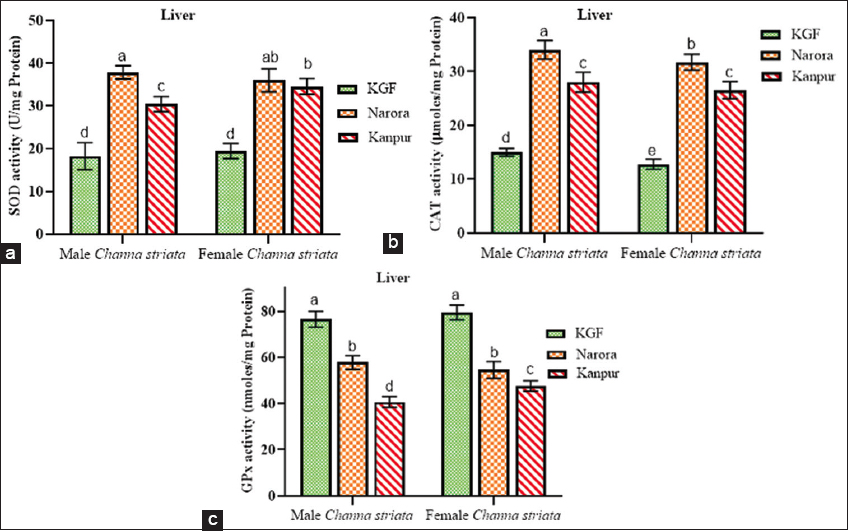 | Figure 1: (a-c) Superoxide dismutase, catalase, and glutathione peroxidase activity in the liver of male and female Channa striata collected from reference and study sites. Data are presented as mean ± standard deviation. Statistical comparisons were performed using two-way analysis of variance followed by Tukey’s post hoc test. Different superscript indicates a statistically significant difference set at a significance level of P < 0.05. [Click here to view] |
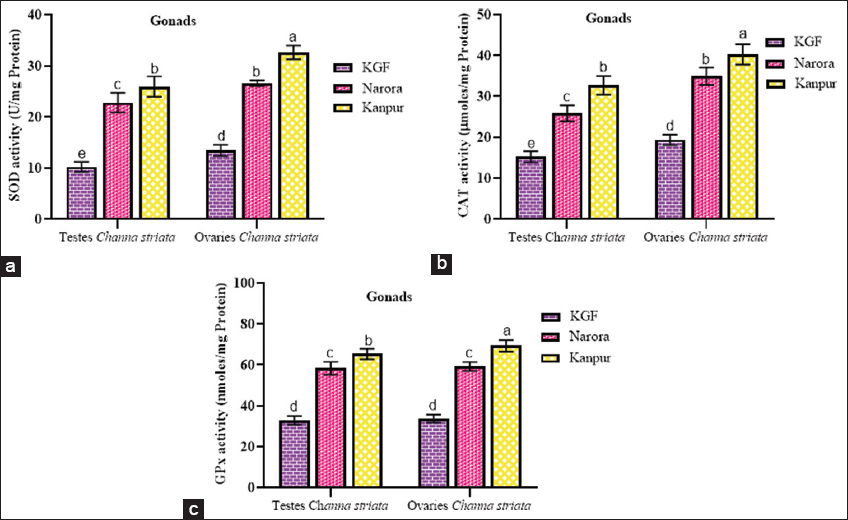 | Figure 2: (a-c) Superoxide dismutase, catalase, and glutathione peroxidase activity in the gonads of male and female Channa striata collected from reference and study sites. Data are presented as mean ± standard deviation. Statistical comparisons were performed using two-way analysis of variance followed by Tukey’s post hoc test. Different superscript indicates a statistically significant difference set at a significance level of P < 0.05. [Click here to view] |
3.4.1. Effect of heavy metals on antioxidant enzyme activities in the liver
SOD and CAT activities were significantly higher (P < 0.05) at Narora and Kanpur compared to the reference site (KGF) in both sexes. For both enzymes, activities were consistently lower at Kanpur than at Narora, with males exhibiting a greater reduction than females. In contrast, GPx activity in liver tissues showed a significant (P < 0.05) decrease at both Narora and Kanpur compared to KGF in male and female brooders.
3.4.2. Effect of heavy metals on antioxidant enzyme activities in the gonads
The activities of SOD, CAT, and GPx in the gonadal tissues (testes and ovaries) exhibited a significant (P < 0.05) increase at both sites in comparison to the reference site. For all enzymes, activities were consistently greater at Kanpur than at Narora in both sexes. Among the tissues, the ovaries displayed significantly (P < 0.05) higher SOD and CAT activities than testes at both Narora and Kanpur, suggesting a sex-specific variation in enzyme response.
A similar pattern was observed for GPx activity, where enzyme levels increased at the contaminated sites in both sexes, with the elevation being more pronounced in the ovaries than testes at Kanpur.
3.5. MT Concentration in the Liver and Gonads
MT levels in the liver and gonads of brooders across the three sites are presented in Figure 3. The MT content in the liver and gonads (testes and ovaries) showed a significant (P < 0.05) increase at both contaminated sites. In males, both the liver and testes exhibited elevated levels of MT at the Narora and Kanpur sites. Similarly, females showed a consistent increase in MT content in both the liver and ovaries across the study sites. The increase in MT was more pronounced in the gonadal tissues, particularly in the ovaries, than in the liver.
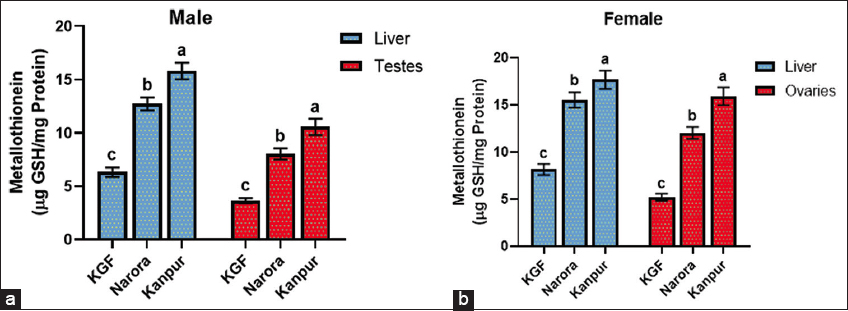 | Figure 3: (a and b) Metallothionein content in the liver and gonads of male and female Channa striata collected from reference and study sites. Data are presented as mean ± standard deviation. Statistical analysis was performed by one-way analysis of variance. Different superscript indicates a statistically significant difference set at a significance level of P < 0.05. [Click here to view] |
3.6. Effect of Heavy Metals on Reproductive Hormones
A significant (P < 0.05) elevation in reproductive hormone levels along different levels of environmental contamination was noted [Figure 4]. In males, testosterone concentrations demonstrated a marked decline corresponding to the increasing pollution levels. The highest testosterone level was observed at the KGF reference site, followed by a substantial reduction at Narora, with the lowest level at Kanpur. Estradiol levels in males exhibited a similar decreasing trend, indicating suppression of gonadal steroidogenesis under elevated heavy metal stress. In females, estradiol concentrations declined significantly (P < 0.05) across the sites. This decline is consistent with pollution-induced impairment of ovarian function. Testosterone levels in females significantly increased at the polluted sites compared to the reference site.
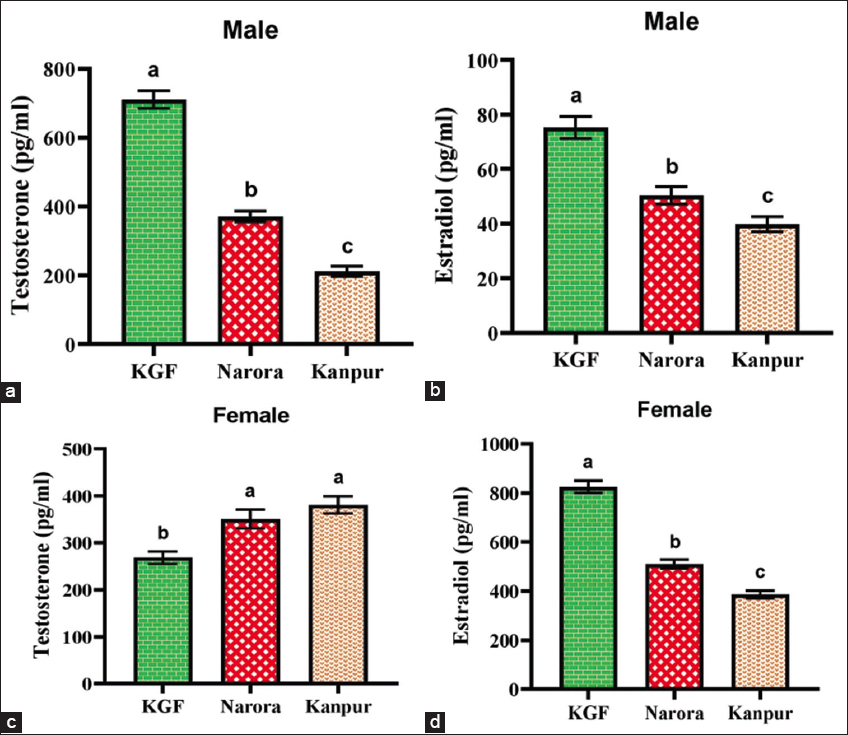 | Figure 4: (a and b) Testosterone and estradiol in male Channa striata, whereas (c and d) testosterone and estradiol in female Channa striata from all three sites. Data are presented as mean ± standard deviation. Statistical analysis was performed by one-way analysis of variance. Different superscripts indicate a statistically significant difference set at a significance level of P < 0.05. [Click here to view] |
3.7. Vtg and ERα as Genotoxic Biomarkers of Metal Toxicity
3.7.1. Site-specific expression of Vtg and ERα
The expression levels of ERα and Vtg genes were analyzed and compared among sites to assess the molecular effects of heavy metal contamination [Figure 5]. ERα expression levels exhibited a marked increase in both male and female fish collected from the Ganga river sites, indicating a clear response to heavy metal pollution. In males, ERα expression was significantly (P < 0.05) elevated at Kanpur (63.49) and Narora (24.86) when compared to the reference site. Similarly, in females, ERα expression was significantly (P < 0.05) higher at Kanpur (22.21) and Narora (7.03) relative to KGF. Vtg gene expression levels were also elevated at the contaminated sites. In males, Vtg expression showed a significant (P < 0.05) increase at Kanpur (8.55) and Narora (8.40) relative to the KGF. In females, expression followed the same trend, with significantly (P < 0.05) higher levels at Kanpur (4.93) and Narora (3.09) compared to KGF.
 | Figure 5: (a and b) The relative expression of estrogen receptor-alpha (ERα) and Vitellogenin (Vtg) in Channa striata based on sites. Data are presented as mean ± standard deviations. Statistical analysis was performed by one-way analysis of variance. The different superscripts indicate a statistically significant difference set at a significance level of P < 0.05. [Click here to view] |
3.7.2. Sex-specific expression of Vtg and ERα
Both Vtg and ERα demonstrated sex-specific differences depicted in Figure 6, analyzed by two-way ANOVA. At the reference site (KGF), males exhibited markedly lower Vtg and ERα expression than females. Male Vtg levels increased at both contaminated sites; at Narora, they reached values comparable to females, whereas at Kanpur, male Vtg expression remained significantly lower (P < 0.05) than females. ERα expression in males was significantly lower at KGF but increased markedly at both Narora and Kanpur. At Narora, males exhibited the highest ERα expression, which was significantly (P < 0.05) greater than the corresponding female group. At Kanpur, males also showed significantly (P < 0.05) higher ERα levels than females, although the magnitude of induction was lower than at Narora.
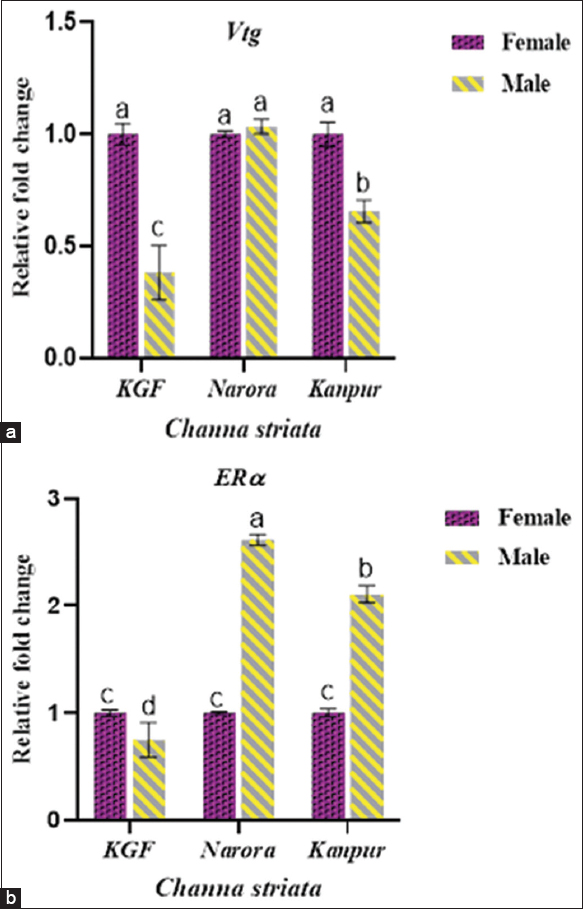 | Figure 6: (a and b) The relative expression of vitellogenin (Vtg) and estrogen receptor-alpha (ERα) in Channa striata based on gender across reference and study sites. Data are presented as mean ± standard deviation. Statistical comparisons were performed using two-way analysis of variance followed by Tukey’s post hoc test. Different superscript indicates a statistically significant difference set at a significance level of P < 0.05. [Click here to view] |
3.8. Correlation Analysis between Heavy Metals and MT
MT was correlated with heavy metals because it shows a direct dose-dependent response to metal exposure, whereas other physiological markers are influenced by multiple regulatory factors.
3.8.1. Correlation analysis between heavy metals and MT in male C. striata liver
Correlation analysis showed that MT levels in the male C. striata liver were positively and significantly correlated with all the heavy metals analyzed [Table 6]. The correlation coefficients were r = 0.958 (P < 0.001) for Cu, r = 0.967 (P < 0.001) for Fe, r = 0.946 (P < 0.001) for Ni, r = 0.987 (P < 0.001) for Cr, r = 0.957 (P < 0.001) for Cd, and r = 0.971 (P < 0.001) for Pb. These results indicate that MT concentrations increased consistently with increasing levels of heavy metals in the livers of male C. striata.
Table 6: Correlation between heavy metals (Cu, Fe, Ni, Cr, Cd, and Pb) and metallothionein levels in the liver and testes of male Channa striata.
| Heavy metals | Liver | Testes | ||
|---|---|---|---|---|
| P-value | Pearson value (r) | P-value | Pearson value (r) | |
| Cu | <0.001 | 0.958 | <0.001 | 0.960 |
| Fe | <0.001 | 0.967 | <0.001 | 0.962 |
| Ni | <0.001 | 0.946 | <0.001 | 0.892 |
| Cr | <0.001 | 0.987 | <0.001 | 0.971 |
| Cd | <0.001 | 0.957 | <0.001 | 0.955 |
| Pb | <0.001 | 0.971 | <0.001 | 0.982 |
All correlations were significant at P<0.001.
3.8.2. Correlation analysis between heavy metals and MT in female C. striata liver
In the female liver, MT levels also showed significant positive correlations with all the heavy metals (Table 7, P < 0.001). The correlation coefficients were r = 0.981 (P < 0.001) for Cu, r = 0.980 (P < 0.001) for Pb, r = 0.979 (P < 0.001) for Fe, r = 0.973 (P < 0.001) for Cd, r = 0.931 (P < 0.001) for Ni, and r = 0.876 (P < 0.001) for Cr. These findings confirm that MT levels increased proportionately with rising metal accumulation in the female C. striata liver.
Table 7: Correlation between heavy metals (Cu, Fe, Ni, Cr, Cd, and Pb) and metallothionein levels in the liver and ovaries of female Channa striata.
| Heavy metals | Liver | Ovaries | ||
|---|---|---|---|---|
| P-value | Pearson value (r) | P-value | Pearson value (r) | |
| Cu | <0.001 | 0.981 | <0.001 | 0.984 |
| Fe | <0.001 | 0.979 | <0.001 | 0.985 |
| Ni | <0.001 | 0.931 | <0.001 | 0.960 |
| Cr | <0.001 | 0.876 | <0.001 | 0.980 |
| Cd | <0.001 | 0.973 | <0.001 | 0.977 |
| Pb | <0.001 | 0.980 | <0.001 | 0.972 |
All correlations were significant at P<0.001.
3.8.3. Correlation analysis between heavy metals and MT in male C. striata testes
Correlation analysis showed that MT levels in the testes of male C. striata were positively and significantly correlated with all the heavy metals studied (Table 6, P < 0.001). The correlation coefficients were r = 0.960 (P < 0.001) for Cu, r = 0.962 (P < 0.001) for Fe, r = 0.892 (P < 0.001) for Ni, r = 0.971 (P < 0.001) for Cr, r = 0.955 (P < 0.001) for Cd, and r = 0.982 (P < 0.001) for Pb. These results indicate that MT levels in the male testes increased consistently with increasing heavy metal accumulation.
3.8.4. Correlation analysis between heavy metals and MT in female C. striata ovaries
Correlation analysis showed that MT levels in the ovaries of female C. striata were positively and significantly correlated with all the heavy metals studied (Table 7, P < 0.001). The correlation coefficients were r = 0.984 (P < 0.001) for Cu, r = 0.985 (P < 0.001) for Fe, r = 0.960 (P < 0.001) for Ni, r = 0.980 (P < 0.001) for Cr, r = 0.977 (P < 0.001) for Cd, and r = 0.972 (P < 0.001) for Pb. These results indicate that MT levels in the female ovaries increased correspondingly with increasing concentrations of heavy metals.
4. DISCUSSION
The observed variations in water quality parameters among the three sites indicate distinct pollution levels, with Kanpur showing maximum deviation from ideal conditions due to intensive anthropogenic activities and tannery effluent discharge. Elevated temperature, reduced DO, higher TDS, and conductivity at Kanpur reflect organic and inorganic loadings that increase microbial O2 demand. Tannery effluents rich in chromium, lead, cadmium, and organic matter elevate BOD, further depleting DO [36]. In addition, untreated sewage and agricultural runoff contribute fertilizers and salts, raising conductivity and turbidity [37]. These findings agree with reports highlighting the Kanpur to Varanasi stretch as a hotspot of anthropogenic stress [38]. Among heavy metals, Fe and Cr were most abundant due to tannery discharge and industrial runoff [39]. Metals such as Pb, Cd, and Ni are linked to dyeing and electroplating in leather processing, while Cu and Ni are used for antimicrobial and finishing purposes [40,41]. Geological weathering also contributes Fe through lithological leaching in the Ganga basin [42]. Higher Ni levels at Narora likely originate from local lock industries. Agricultural inputs further raise Cd, Pb, and Cr concentrations, especially during monsoon runoff [43]. Thus, the metal contamination pattern across sites reflects both industrial and agricultural sources. Higher metal accumulation in liver than muscle supports its role as the primary detoxification organ, capable of metal sequestration through metalloproteins like ferritin [44-46]. In contrast, muscle tissues accumulate fewer metals due to lower metabolic activity and limited metal-binding sites.
Higher GSI in females reflects their greater reproductive investment during the breeding season. The reduced GSI values at Kanpur suggest that heavy metal pollution interferes with hormonal regulation and diverts energy away from gonadal development, leading to suppressed reproductive investment. Similar reductions in GSI under metal exposure have been reported in a study [47]. Elevated HSI values in males at Kanpur indicate severe hepatic stress due to elevated heavy metal bioaccumulation, which can cause hepatocellular injury and fatty degeneration [48]. In contrast, females showed lower HSI values, likely because hepatic reserves were mobilized for gonadal development during the spawning phase, resulting in high GSI but reduced liver weight [49]. The condition factor (K) was higher in females due to larger gonads, and overall K values were highest at KGF, reflecting better environmental conditions. The lowest K values at Kanpur suggest impaired health and poor condition of C. striata under heavy metal pollution.
At the polluted sites, variations in heavy metal concentrations were associated with changes in antioxidant enzyme activities in the gonads, suggesting altered cellular regulation under contaminated conditions [50]. However, in the liver, although SOD and CAT activities increased, GPx activity declined, a pattern that may reflect differences in enzyme sensitivity or regulation under higher heavy metal exposure [51]. Similarly, a study observed a decrease in GPx in Indian major carps exposed to heavy metal exposure, which was related to a decline in GSH and glutathione reductase (GRd) activity [52]. These patterns suggest that heavy metal exposure may affect hepatic antioxidant enzyme functioning, particularly at Kanpur. The greater reduction in GPx in males further points to sex-related differences in enzyme responsiveness, with males appearing more susceptible under heavy pollution. This male-specific susceptibility might be due to physiological or hormonal differences influencing metal accumulation and antioxidant enzyme regulation [53,54]. In contrast, females tended to exhibit relatively higher antioxidant activities in the gonads, possibly reflecting reproductive-associated metabolic demands during oocyte development [55].
The elevation of MT observed across tissues and genders reflects a physiological defense mechanism against heavy metal exposure. MT binds and sequesters metals such as Cu, Cd, Pb, and Cr, thereby reducing their toxic effects. A study also found that exposure to heavy metals in Prochilodus costatus increased MT levels [56]. The progressive increase in MT from KGF to Narora and Kanpur corresponds with the rising metal burden along this pollution gradient, suggesting its usefulness as an indicator of metal exposure. Although the liver is the primary detoxification organ and accumulates higher metal concentrations, comparatively greater MT induction in the ovary can be attributed to reproductive physiology. During the breeding season, MT concentrations in the liver tend to decrease to release Zn, which is required to stabilize membrane structures involved in Vtg synthesis and secretion [57,58]. As a result, ovarian MT levels remain elevated, which may contribute to maintaining metal homeostasis within the gonads and support reproductive processes under contaminated conditions. The positive correlations observed between heavy metals and MT levels across liver and gonadal tissues further support this association. The strong correlation indicates that MT synthesis increased in direct proportion to metal burden, confirming that MT induction is a metal-responsive regulatory mechanism rather than a random physiological variation.
The hormone variations across sites indicate heavy metal-induced endocrine disruption. The decrease in testosterone in males at Narora and Kanpur is linked to metal interference with steroidogenic enzymes and the hypothalamic–pituitary–gonadal axis, consistent with findings from the Kor River, where fish exposed to lead (Pb) and cadmium (Cd) exhibited lower estradiol and testosterone levels compared to those from uncontaminated regions [59]. Metals can inhibit 17β-hydroxysteroid dehydrogenase, directly reducing testosterone biosynthesis [60]. In females, the decline in estradiol may be attributed either to the toxic effects of metals on the hypothalamic–pituitary axis or to impaired estradiol production by germinal cells [61,62]. The elevated testosterone in females suggests aromatase (CYP19A1a) inhibition by metals such as Pb and Cr, preventing conversion of testosterone to estradiol [63]. The strong association between Pb, Cd, and Cr bioaccumulation in gonadal tissues and altered hormone levels aligns with previous studies on other fish species, where similar patterns of hormonal disruption and metal bioaccumulation were observed [64,65].
The increased expression of ERα and Vtg at Narora and Kanpur indicates estrogenic pathway activation in response to heavy metal exposure. Several heavy metals are known to act as xenoestrogens or interfere with estrogen signaling, which explains the induction of these genes under polluted conditions [22,66]. Since ERα and Vtg synthesis are normally regulated by 17β-estradiol (E2), their expression in males is widely recognized as a biomarker of endocrine disruption [21]. The greater induction of ERα in males may reflect higher metal accumulation and greater sensitivity, possibly due to sex-specific differences in metal uptake and detoxification processes [53]. The low expression at the reference site (KGF) further confirms that heavy metals are responsible for this response. The induction of Vtg in males also highlights that male fish can serve as effective indicators of estrogenic pollution, as they possess the necessary receptors and cellular machinery for Vtg synthesis [67].
5. CONCLUSION
The study confirms that heavy metal contamination in the Ganga River causes bioaccumulation in C. striata, leading to altered antioxidant enzyme activities, hormonal imbalance, and bioindices. Elevated MT levels and changes in Vtg and estrogen receptor alpha expression reflect severe endocrine disruption at polluted sites, particularly Kanpur. These findings validate the hypothesis that heavy metal exposure impairs reproductive health and establish C. striata as a reliable bioindicator of aquatic metal toxicity.
6. AUTHORS’ CONTRIBUTIONS
All authors made substantial contributions to the conception and design, acquisition of data, or analysis and interpretation of data; took part in drafting the article or revising it critically for important intellectual content; agreed to submit to the current journal; gave final approval of the version to be published; and agreed to be accountable for all aspects of the work. All the authors are eligible to be an author as per the International Committee of Medical Journal Editors requirements/guidelines.
7. ACKNOWLEDGMENT
The authors acknowledge the University Grants Commission (UGC), Government of India, for providing financial support for this study under the MANF-JRF fellowship (202021-UP02600630).
8. CONFLICTS OF INTEREST
The authors report no financial or any other conflicts of interest in this work.
9. ETHICAL APPROVALS
All experimental procedures were conducted in accordance with the guidelines prescribed by the Ministry of Environment and Forests, Government of India, under registration no. CPCSEA/BC/P-8/2023–24, issued by the Committee for Control and Supervision of Experiments on Animals (CPCSEA), New Delhi, and were approved by the Institutional Animal Ethics Committee, Department of Biochemistry, Aligarh Muslim University, Aligarh, India.
10. DATA AVAILABILITY
All the data is available with the authors and shall be provided upon request.
11. PUBLISHER’S NOTE
All claims expressed in this article are solely those of the authors and do not necessarily represent those of the publisher, the editors and the reviewers. This journal remains neutral with regard to jurisdictional claims in published institutional affiliation.
12. USE OF ARTIFICIAL INTELLIGENCE (AI)-ASSISTED TECHNOLOGY
The authors declare that they have not used artificial intelligence (AI)-tools for writing and editing of the manuscript, and no images were manipulated using AI.
REFERENCES
1. Akhtar N, Syakir Ishak MI, Bhawani SA, Umar K. Various natural and anthropogenic factors responsible for water quality degradation:A review. Water. 2021;13(19):2660. [CrossRef]
2. Dwivedi S, Mishra S, Tripathi RD. Ganga water pollution:A potential health threat to inhabitants of Ganga basin. Environ Int. 2018;117:327-38. [CrossRef]
3. Sharmila S, Arockiarani I. A pollution model of the River Ganges through inter criteria analysis. Int J Ocean Oceanogr. 2016;10:81-91.
4. Das S. Cleaning of the Ganga. J Geol Soc India. 2011;78:124-130. [CrossRef]
5. CPCB. Performance evaluation of sewage treatment plants under NRCD. New Delhi: Central Pollution Control Board, Ministry of Environment and Forests, Government of India;2013a.
6. National Mission for Clean Ganga (NMCG). Hybrid annuity-based PPP model for creation of sewage treatment infrastructure. New Delhi: Ministry of Water Resources, Government of India;2017.
7. Bajaj G, Quadir A. Integrated approach for sustainable waste management in Kanpur city. Int J Sci Res Publ. 2025;15(5):1-7. [CrossRef]
8. Banday UZ, Swaleh SB, Usmani N. Insights into the heavy metal-induced immunotoxic and genotoxic alterations as health indicators of Clarias gariepinus inhabiting a rivulet. Ecotoxicol Environ Saf. 2019;183:109584. [CrossRef]
9. Swaleh SB, Banday UZ, Usmani N. Comparative study of biochemical, histological and molecular biomarkers of heavy metal contamination in Cyprinus carpio collected from warm-monomictic lake and government culture pond. Chemosphere. 2019;236:124182. [CrossRef]
10. Agbugui MO, Abe GO. Heavy metals in fish: Bioaccumulation and health. Br J Earth Sci Res. 2022;10(1):47-66. [CrossRef]
11. Vu CT, Lin C, Yeh G, Villanueva MC. Bioaccumulation and potential sources of heavy metal contamination in fish species in Taiwan: Assessment and possible human health implications. Environ Sci Pollut Res. 2017;24:19422-34. [CrossRef]
12. Rajeshkumar S, Liu Y, Ma J, Duan HY, Li X. Effects of exposure to multiple heavy metals on biochemical and histopathological alterations in common carp, Cyprinus carpio L. Fish Shellfish Immunol. 2017;70:461-72. [CrossRef]
13. Ighodaro OM, Akinloye OA. First line defence antioxidants-superoxide dismutase (SOD), catalase (CAT) and glutathione peroxidase (GPX): Their fundamental role in the entire antioxidant defence grid. Alex J Med. 2018;54(4):287-93. [CrossRef]
14. Bakiu R, Pacchini S, Piva E, Schumann S, Tolomeo AM, Ferro D, et al. Metallothionein expression as a physiological response against metal toxicity in the striped rockcod Trematomus hansoni. Int J Mol Sci. 2022;23(21):12799. [CrossRef]
15. Cosson RP, Amiard JC. Use of metallothioneins as biomarkers of exposure to metals. In Use of biomarkers for environmental quality assessment. United States: CRC Press;2021. 79-111. [CrossRef]
16. Gabilondo AR, Pérez LH, Rodríguez RM. Hormonal and neuroendocrine control of reproductive function in teleost fish. Rev Bionat. 2022;6(3):2122-33. [CrossRef]
17. Tomy S. Estrogenic regulation of reproduction in teleosts. In: Recent updates in molecular Endocrinology and Reproductive Physiology of Fish: An Imperative step in Aquaculture. Berlin: Springer;2021. 35-52. [CrossRef]
18. Gupta G, Kumar M, Rani S, Mohanta B. Vitellogenesis and their endocrine control in fishes. In: Recent updates in molecular endocrinology and reproductive physiology of fish: An Imperative step in Aquaculture;2021. p. 23-34. [CrossRef]
19. Nelson ER, Habibi HR. Estrogen receptor function and regulation in fish and other vertebrates. Gen Comp Endocrinol. 2013;192:15-24. [CrossRef]
20. Ye Z, Zhao T, Wei Q, Lin H, Zhang Y, Li S. Distinct roles of estrogen receptors in the regulation of vitellogenin expression in orange-spotted grouper (Epinephelus coioides). Int J Mol Sci. 2022;23(15):8632. [CrossRef]
21. Chen JR, Wu SM, Tsai SC, Hsien FC, Huang CT. Changes in vitellogenin and estrogen receptor expression and 17b-estradiol concentration in male juvenile tilapia can be used to evaluate endocrine-disrupting chemicals. Comp Biochem Physiol Part C Toxicol Pharmacol. 2020;229:108682. [CrossRef]
22. Roy D, Mitra A, Homechaudhuri S. Differential expression of genes responsible for reproduction of male and female danio rerio following interaction between estrogen receptor and cadmium. Proc Zool Soc. 2021;74:456-65. [CrossRef]
23. Liwszyc GE, Larramendy ML, editors. Fish Species in Environmental Risk Assessment Strategies. London: Royal Society of Chemistry;2024. [CrossRef]
24. Kumar M, Gupta N, Ratn A, Awasthi Y, Prasad R, Trivedi A, et al. Biomonitoring of heavy metals in river ganga water, sediments, plant, and fishes of different trophic levels. Biol Trace Element Res. 2020;193:536-47. [CrossRef]
25. Vaseem H, Banerjee TK. Evaluation of pollution of Ganga River water using fish as bioindicator. Environ Monit Assessment. 2016;188:1-9. [CrossRef]
26. American Public Health Association, American Water Works Association, Water Environment Federation. Standard Methods for the Examination of Water and Wastewater. 20th ed. Washington, DC: American Public Health Association;1998
27. American Public Health Association, American Water Works Association, Water Environment Federation. Standard Methods For The Examination of Water and Waste Water 21st ed. Washington, DC:American Water Works Association;2005.
28. Desai VR. Studies on the fishery and biology of Tor tor (Hamilton) from river Narmada. J Inland Fish Soc India. 1970;2(5):101-12.
29. McCord JM, Fridovich I. Superoxide dismutase: An enzymic function for erythrocuprein (hemocuprein). J Biol Chem. 1969;244(22):6049-55. [CrossRef]
30. Lushchak VI, Bagnyukova TV. Temperature increase results in oxidative stress in goldfish tissues. 1. Indices of oxidative stress. Comp Biochem Physiol Part C Toxicol Pharmacol. 2006;143(1):30-5. [CrossRef]
31. Paglia DE, Valentine WN. Studies on the quantitative and qualitative characterization of erythrocyte glutathione peroxidase. J Lab Clin Med. 1967;70(1):158-69.
32. Viarengo A, Ponzano E, Dondero F, Fabbri R. A simple spectrophotometric method for metallothionein evaluation in marine organisms:An application to Mediterranean and Antarctic molluscs. Mar Environ Res. 1997;44(1):69-84. [CrossRef]
33. Chomczynski P, Mackey K. Short technical reports. Modification of the TRI reagent procedure for isolation of RNA from polysaccharide-and proteoglycan-rich sources. Biotechniques. 1995;19(6):942-5.
34. Almog R, Shirey TL. A modified orcinol test for the specific determination of RNA. Analyt Biochem. 1978;91(1):130-7. [CrossRef]
35. Livak KJ, Schmittgen TD. Analysis of relative gene expression data using real-time quantitative PCR and the 2- DDCT method. Methods. 2001;25(4):402-8. [CrossRef]
36. Nigam M, Mishra P, Kumar P, Rajoriya S, Pathak P, Singh SR, et al. Comprehensive technological assessment for different treatment methods of leather tannery wastewater. Environ Sci Pollut Res. 2023;30(60):124686-703. [CrossRef]
37. Kumar N, Kumar D, Kumar S, Shukla V, Shukla P, Raj B. Spatio-temporal variations in hydro-geochemistry of groundwater at rural, urban and industrial areas of Kanpur, India. Environ Sustain. 2018;1:197-208. [CrossRef]
38. Modi A, Bhagat C, Mohapatra PK. Impact of urbanization on Ganga river basin: An overview in the context of natural surface water resources. In: Impacts of urbanization on hydrological systems in India. Berlin:Springer;2023. 111-27. [CrossRef]
39. Arti, Mehra R. Analysis of heavy metals and toxicity level in the tannery effluent and the environs. Environ Monit Assess. 2023;195(5):554. [CrossRef]
40. Deepak N, Inbasekar C. Bactericidal and Fungicidal action of copper nanoparticles on leather surface. J Am Leather Chemists Assoc. 2023;118(12):519-28. [CrossRef]
41. Rambo CR, Lacerda SD, Campestrini LH, Müller D, Marques LD, Hotza D. Acid Leaching-based synthesis of CdS yellow ceramic pigment with discarded Ni-Cd batteries. Mater Res. 2019;22(5):e20190065. [CrossRef]
42. Bertaz J, Huyghe P, France-Lanord C, Galy A, Limonta M, Tachambalath A. Chemical Weathering Processes of Himalaya-River Systems Since Miocene Recorded by Bulk and Clay Mineralogy of Deep-Sea Sediments from IODP Expedition 354. In: EGU General Assembly Conference Abstracts;2024. p. 17264. [CrossRef]
43. Upadhyay V, Kumari A, Kumar S. From soil to health hazards: Heavy metals contamination in northern India and health risk assessment. Chemosphere. 2024;354:141697. [CrossRef]
44. Mukherjee J, Saha NC, Karan S. Bioaccumulation pattern of heavy metals in fish tissues and associated health hazards in human population. Environ Sci Pollut Res. 2022;29:21365-79. [CrossRef]
45. Samuel B, Sorsa S, Daniel F, Riise G, Zinabu GM. Heavy metals in fish muscle from an Ethiopian rift-Valley Lake (Hawassa) and a neighboring stream (Boicha):Assessment of human health risks. J Appl Sci Environ Manag. 2020;24(8):1409-18. [CrossRef]
46. Vogt AC, Arsiwala T, Mohsen M, Vogel M, Manolova V, Bachmann MF. On iron metabolism and its regulation. Int J Mol Sci. 2021;22(9):4591. [CrossRef]
47. Taslima K, Al-Emran M, Rahman MS, Hasan J, Ferdous Z, Rohani MF, et al. Impacts of heavy metals on early development, growth and reproduction of fish-a review. Toxicol Rep. 2022;9:858-68. [CrossRef]
48. Topi?Popovi?N, ?ižmek L, Babi?S, Strunjak-Perovi?I, ?ož-Rakovac R. Fish liver damage related to the wastewater treatment plant effluents. Environ Sci Pollut Res. 2023;30(17):48739-68. [CrossRef]
49. Korkmaz C, Ay Ö, Dönmez AE, Demirba?B, Erdem C. Influence of lead on reproductive physiology and gonad and liver histology of female Cyprinus carpio. Thalassas Int J Mar Sci. 2020;36(2):597-606. [CrossRef]
50. Kumar M, Singh S, Jain A, Yadav S, Dubey A, Trivedi SP. A review on heavy metal-induced toxicity in fishes: Bioaccumulation, antioxidant defense system, histopathological manifestations, and transcriptional profiling of genes. J Trace Elements Med Biol. 2024;83:127377. [CrossRef]
51. Ahn TY, Park HJ, Kim JH, Kang JC. Effects of antioxidant enzymes and bioaccumulation in eels (Anguilla japonica) by acute exposure of waterborne cadmium. Fish Aquat Sci. 2020;23(1):23. [CrossRef]
52. Das D, Moniruzzaman M, Sarbajna A, Chakraborty SB. Effect of heavy metals on tissue-specific antioxidant response in Indian major carps. Environ Sci Pollut Res. 2017;24:18010-24. [CrossRef]
53. Adeogun AO, Ibor OR, Omiwole R, Chukwuka AV, Adewale AH, Kumuyi O, et al. Sex-differences in physiological and oxidative stress responses and heavy metals burden in the black jaw tilapia, Sarotherodon melanotheron from a tropical freshwater dam (Nigeria). Comp Biochem Physiol Part C Toxicol Pharmacol. 2020;229:108676. [CrossRef]
54. Madenjian CP, Rediske RR, Krabbenhoft DP, Stapanian MA, Chernyak SM, O'Keefe JP. Sex differences in contaminant concentrations of fish: A synthesis. Biol Sex Dif. 2016;7:1-6. [CrossRef]
55. Wang S, He G, Chen M, Zuo T, Xu W, Liu X. The role of antioxidant enzymes in the ovaries. Oxid Med Cell Longev. 2017;2017(1):4371714. [CrossRef]
56. Paschoalini AL, Ribeiro YM, Thuller B, Soares CL, Rizzo E, Bazzoli N. Histopathology and changes in the expression of metallothioneins, heat shock proteins and inducible nitric oxide synthase in Prochilodus costatus from a neotropical river contaminated by heavy metals. Environ Toxicol Pharmacol. 2024;108:104473. [CrossRef]
57. Banks SD, Thomas P, Baer KN. Seasonal variations in hepatic and ovarian zinc concentrations during the annual reproductive cycle in female channel catfish (Ictalurus punctatus). Comp Biochem Physiology Part C Pharmacol Toxicol Endocrinol. 1999;124:65-72. [CrossRef]
58. Olsson PE, Zafarullah MU, Gedamu L. A role of metallothionein in zinc regulation after oestradiol induction of vitellogenin synthesis in rainbow trout, Salmo gairdneri. Biochem J. 1989;257(2):555-9. [CrossRef]
59. Ebrahimi M, Taherianfard M. The effects of heavy metals exposure on reproductive systems of cyprinid fish from Kor River. Iran J Fish Sci. 2011;10(1):13-26.
60. Dimastrogiovanni G. Responses to Environmental Xenobiotics:From Endocrine Disruption to Lipid Homeostasis Imbalance. Spain:Universitat de Barcelona;2015.
61. Olivares-Rubio HF, Dzul-Caamal R, Nájera-Martínez M, Vega-López A. disruption of hypothalamus-pituitary-liver-gonads axis in the endangered Girardinichthys viviparus exposed to environmentally relevant concentrations of a mixture of metals and with 17a-ethynil estradiol. Rev Int Contam Ambiental. 2017;33(2):289-302. [CrossRef]
62. Su L, Li H, Qiu N, Wu Y, Hu B, Wang R, et al. Effects of cadmium exposure during the breeding period on development and reproductive functions in rare minnow (Gobiocypris rarus). Front Physiol. 2023;14:1163168. [CrossRef]
63. Chakraborty SB. Non-essential heavy metals as endocrine disruptors: Evaluating impact on reproduction in teleosts. Proc Zool Soc. 2021;74(4):417-31. [CrossRef]
64. Al-Hasawi ZM. Adverse impacts of toxic metal pollutants on sex steroid hormones of Siganus rivulatus (Teleostei:siganidae) from the red sea. Fishes. 2022;7(6):367. [CrossRef]
65. Bhat RA, Bakhshalizadeh S, Guerrera MC, KesbiçOS, Fazio F. Toxic effect of heavy metals on ovarian deformities, apoptotic changes, oxidative stress, and steroid hormones in rainbow trout. J Trace Elements Med Biol. 2023;75:127106. [CrossRef]
66. Paschoalini AL, Savassi LA, Arantes FP, Rizzo E, Bazzoli N. Heavy metals accumulation and endocrine disruption in Prochilodus argenteus from a polluted neotropical river. Ecotoxicol Environ Saf. 2019;169:539-50. [CrossRef]
67. Ankley GT, Johnson RD. Small fish models for identifying and assessing the effects of endocrine-disrupting chemicals. ILAR J. 2004;45(4):469-83. [CrossRef]