
1. INTRODUCTION
Approximately half the global population receives calories from rice [1]. As a staple food, rice provides over 21% of the global caloric requirements and up to 76% of the calories consumed in Southeast Asia [2]. The global production of rice in 2021 was 787.3 million metric tons [3]. By 2030, it is projected that the world’s rice production will increase by 11.4%, reaching 567 million tonnes (Mt) [4]. India is considered the second-largest paddy producer in the world after China. India has produced over 135.8 million metric tons of milled rice in the 2022/2023 crop year [5]. The world’s population is projected to reach 9.7 billion by 2050 and 10.9 billion by 2100 [4]. Therefore, rice remains one of the most strategic commodities in the world. It is not only linked to global food security but is also closely connected to economic growth [6].
Kalanamak rice is a medium-grain, non-basmati aromatic variety native to eastern Uttar Pradesh, India. It is extensively recognized for its aroma, taste, and nutritional value [7]. The high iron and zinc content of Kalanamak rice has led to its selection as a nutrient crop [8]. Both Vitamin E and phenolic contents are high in this rice grain [9]. Kalanamak rice has medicinal properties and may help control breast cancer and heart-related diseases, and improve eye health and weight management [10]. In addition, Kalanamak rice has a low GI of 49–52%, which makes it suitable for people with diabetes [11]. The cultivation area of Kalanamak rice has significantly decreased, primarily due to the tall height of the plant and long maturation period.
Mutation breeding is an effective technique for creating new genetic and phenotypic variations. Physical mutagens, like gamma irradiation, can induce significant genetic mutations through large chromosomal deletions and chromosome reconstitution [12]. Among mutagens, gamma rays are the most commonly used in rice breeding [13]. Mutations caused by gamma-ray irradiation can enhance agronomic traits in rice plants, such as shorter stems and earlier maturation [14]. The most recent data show that more than 873 rice mutant types have been formally released globally [15]. The number of gamma radiation-induced rice mutants was over 225 [15].
Harnessing the genetic diversity of agronomic characteristics is vital for breeding programs that enhance the rice gene pool [16]. In the initial experiments, a gamma-ray dose of 150 Gy was determined to be optimal based on the LD50 studies [17]. Subsequently, the M1, M2, and M3 generations of mutant plants were field-tested, and their agronomic characteristics were evaluated. In the present study, field trials were conducted for the M4 and M5 generations along with the control plants. The mean and median values of various agronomic traits were compared, and the relationships between these traits were analyzed using principal component analysis (PCA).
2. MATERIALS AND METHODS
2.1. Field Trial
A total of 250 mutant plant seeds were selected for field trial for the M4 generation, emanating from individual progenies of the M3 generation, based on evaluations of plant height and yield-related characteristics. From these, the 100 best-performing mutant plants were selected for further assessment at maturity in the M4 generation. Furthermore, 150 seeds for the M5 generation were obtained from the individual selection of plants in the M4 generation, from these 100 healthy and best-performing mutants were selected to evaluate their characteristics at maturity in the M5 generation. The experiment was conducted at the Educational and Research Botanical Garden of the Department of Botany at the Deen Dayal Upadhyaya Gorakhpur University, situated at 26.7° N and 83.3° E, by following the method of Sao et al. [18]. A field-based nursery was established for M4 and M5 seeds, along with 100 control seeds, during June 2022 and 2023. After 20 days, the seedlings moved to a randomized block design setup with control plants. The field layout featured a row spacing of 20 cm while maintaining a plant distance of 15 cm apart. Recommended fertilizer doses were applied, and the necessary plant protection measures were implemented throughout the various stages of crop growth. Once the surviving seedlings matured, several agronomic characteristics were evaluated: Plant height (cm), leaf area (L/A cm2), number of productive tillers per plant, panicle length (cm), number of spikelets per panicle, number of filled spikelets per panicle, primary branching number per panicle, and 1,000 seed weight (g).
2.2. Statistical Analysis
Descriptive statistics (Mean ± Standard deviation and Median) were calculated for continuous variables. To compare average values of traits such as leaf area, plant height, number of productive tillers per plant, panicle length, number of spikelets per panicle, number of filled spikelets per panicle, primary branching number per panicle, and 1,000-seed weight across control-M4, control-M5, and M4-M5, corresponding parametric/non-parametric tests were applied. The normality of variables was checked using the Kolmogorov–Smirnov test P < 0.05, which was considered statistically significant. Variables found to be normally distributed were compared by applying an independent samples t-test, while non-normally distributed variables were tested using the Mann–Whitney U-test. Finally, the interdependence multivariate technique, that is, PCA, was applied to reduce the dimensions of various agronomic traits and identify the relationship between them. PCA is a widely used statistical technique that transforms a dataset with multiple interrelated variables into a set of uncorrelated variables called principal components. The data reduction process through this transformation maintains maximum variation while lowering the number of dimensions. Each principal component is a linear combination of original variables which have been arranged so the first few components retain the most total variance. The analysis utilized Bartlett’s test of sphericity to determine whether the data set qualified for PCA. The eigenvalue criterion determined principal component selection by preserving components that exceeded the eigenvalues of one. An eigenvalue exceeding one under the Kaiser criterion demonstrates that a component provides more variance explanation than a single original variable thus becoming fundamental for data interpretation. This method discovered the most important components which resulted in a compact yet detailed depiction of the underlying data structure. The statistical data analysis was carried out with Statistical Packages for the Social Sciences Software v. 25.
3. RESULTS AND DISCUSSION
The normality of various agro-morphological traits was assessed using the Kolmogorov–Smirnov test across control, M4, and M5 generations. P < 0.05 indicated non-normality between control M4 and M5 generations. Parametric or non-parametric tests were used according to the normality or non-normality of the data set. Two independent sample tests were performed based on the normality of the control and mutant progeny M4/M5, to evaluate the differences between the M4 and M5 generations and the control. A comparative study was carried out for different agronomic traits between the control M4 and M5 generations [Tables 1 and 2]. The control group exhibited a significantly higher mean leaf area (51.53 ± 7.93 cm2) compared to both M4 (48.69 ± 7.63 cm2, P = 0.011) and M5 (47.39 ± 11.78 cm2, P = 0.004). However, no significant difference was observed in the mean leaf area between generations M4 and M5. A significant reduction in plant height was observed in both the M4 (139.68 ± 27.15 cm, P < 0.001) and M5 (137.88 ± 27.04 cm, P < 0.001) generations compared to the control (168.6 ± 11.24 cm). However, there was no significant difference in plant height between generations M4 and M5. Although the control showed a higher mean number of productive tillers (11.1 ± 5.4) compared to M4 (9.87 ± 5.68) and M5 (9.91 ± 5.38) generations, these differences were not statistically significant. The panicle length varied significantly among the control, M4, and M5 groups (P < 0.05). The M5 generation showed a slight decrease (24.39 ± 2.84 cm) compared to the control (25.54 ± 3.41 cm), but a slight increase relative to the M4 generation (23.53 ± 2.91 cm). The control group had the highest mean number of spikelets per panicle (208.39 ± 14.92), which was significantly higher than both M5 (154.12 ± 39.11, P < 0.001) and M4 (147.33 ± 27.71, P < 0.001). However, no significant difference was observed in the number of spikelets per panicle between generations M4 and M5. Similarly, the control group exhibited a significantly higher number of filled spikelets per panicle (163.02 ± 15.95) compared to M4 (81.63 ± 31.55, P < 0.001) and M5 (84.45 ± 40.93, P < 0.001). No significant differences were observed in the number of filled spikelets per panicle between generations M4 and M5. The control had the highest mean number of primary branches per panicle (14.55 ± 1.1), which was significantly higher than that of the M4 mutant population (13.15 ± 1.82, P < 0.001) but not significantly different from M5 (14.16 ± 1.88, P = 0.069). However, a significant difference was observed between the M4 and M5 generations, with the M5 generation showing a higher mean (14.16 ± 1.88) than M4 (13.15 ± 1.82). Although slight increases were observed in the 1,000-seed weight for both M4 (16.58 ± 2.26 g) and M5 (16.78 ± 2.35 g) compared to the control (16.12 ± 2.75 g), these differences were not statistically significant. In addition, no significant difference was observed between generations M4 and M5. The results indicated that the M4 and M5 generations exhibited significant differences in morphological traits and yield characteristics compared with the control, particularly in leaf area, plant height, panicle length, number of spikelets per panicle, and number of filled spikelets per panicle. The number of primary branches per panicle was also significantly higher in the control than in M4, but no significant difference was found between the control and M5. The number of primary branches per panicle was also significantly higher in the control than in M5, but not significantly different from that in M5. Although the 1,000-seed weight showed a slight increase in the mutant generations, these differences were not significant. Most morphological traits did not show significant differences between the M4 and M5 generations, suggesting genetic stability between the two mutant lines. However, a significant difference was observed in the number of primary branches per panicle, with M5 having a slightly higher mean number than M4. Other traits, including leaf area, plant height, panicle length, number of spikelets per panicle, number of filled spikelets per panicle, and 1,000-seed weight, remained statistically similar between the two generations.
Table 1: Mean and median performance for different traits in control, M4, and M5 generations rice cultivar Kalanamak.
| Trait | Control | M4 generation | M5 generation | |||
|---|---|---|---|---|---|---|
| (Mean±SD) | Median | (Mean±SD) | Median | (Mean±SD) | Median | |
| Leaf area (L/A cm2) | 51.53±7.93 | 51.13 | 48.69±7.63 | 48.58 | 47.39±11.78 | 46.56 |
| Plant height (cm) | 168.6±11.24 | 170 | 139.68±27.15 | 129.5 | 137.88±27.04 | 127.5 |
| No. of productive tillers per plant | 11.1±5.4 | 10 | 9.87±5.68 | 9 | 9.91±5.38 | 9 |
| Panicle length (cm) | 25.54±3.41 | 26.58 | 23.53±2.91 | 23.83 | 24.39±2.84 | 24.40 |
| No. of spikelets per panicle | 208.39±14.92 | 208.67 | 147.33±27.71 | 149.67 | 154.12±39.11 | 154 |
| No. of filled spikelets per panicle | 163.02±15.95 | 161.83 | 81.63±31.55 | 81.67 | 84.45±40.93 | 77.83 |
| Primary branching number per panicle | 14.55±1.1 | 14.5 | 13.15±1.82 | 13 | 14.16±1.88 | 14 |
| 1,000 seed weight (g) | 16.12±2.75 | 16.58 | 16.58±2.26 | 16.79 | 16.78±2.35 | 16.7 |
SD: Standard deviation
Table 2: Comparison of different agronomic traits among control, M4, and M5 generations.
| Trait | Control-M4 | Control-M5 | M4-M5 | |||
|---|---|---|---|---|---|---|
| Test statistics | Asymp. * Sig. (2-tailed) | Test statistics | Asymp. * Sig. (2-tailed) | Test statistics | Asymp. * Sig. (2-tailed) | |
| Leaf area (L/A cm2) | 2.581t | 0.011* | 2.917t | 0.004* | 0.927t | 0.355 |
| Plant height (cm) | 2192.5U | <0.001* | 1936.5U | <0.001* | 4729.5U | 0.509 |
| No. of productive tillers per plant | 4244U | 0.064 | 4289U | 0.081 | 4912.5U | 0.83 |
| Panicle length (cm) | 3079U | <0.001* | 2.571t | <0.011* | −2.133t | 0.034* |
| No. of spikelets per panicle | 19.403t | <0.001* | 12.965t | <0.001* | −1.417t | 0.158 |
| No. of filled spikelets per panicle | 23.021t | <0.001* | 17.885t | <0.001 | −0.546t | 0.586 |
| Primary branching number per panicle | 2461.5U | <0.001* | 4257U | 0.069 | 3423U | <0.001v |
| 1,000 seed weight (g) | 4596U | 0.324 | 4380U | 0.130 | 4809U | 0.642 |
U-Mann–Whitney U-test statistic; t-independent sample t-test statistic;
* -Significant (P<0.05) *Asymp. Sig.: Asymptotic significance
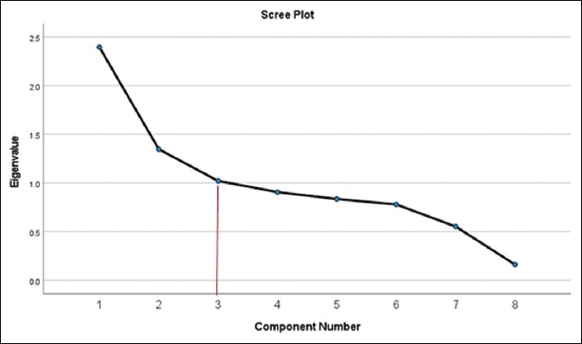
Factor analysis was conducted to further explore the relationships among agronomic traits. A Kaiser–Meyer–Olkin value of 0.626 indicated mediocre sampling adequacy [Table 3]. At the same time, Bartlett’s Test of Sphericity showed a significant chi-square value of 516.032 (df = 28, P < 0.001), confirming the suitability of the data for factor analysis. By considering the interdependence among the characteristics, PCA is used to break down large amounts of data into smaller principal components without losing any detail [19]. Three components were extracted, explaining a cumulative 59.5% of the total variance. This component structure was further supported by the scree plot [Figure 1], which displayed a clear “elbow” at the third component, indicating the point where additional components contribute relatively little to the total variance explained. Component 1 accounted for the 28.3% the total variance explained and was strongly associated with the number of filled spikelets per panicle (loading = 0.912), the number of spikelets per panicle (loading = 0.907), and primary Branching number per panicle (loading = 0.460). It was also moderately associated with panicle length (loading = 0.444). Component 2 explained the 15.8% of total variance and was characterized the 1,000 seed weight (loading = 0.820) and leaf area (loading = 0.445). Component 3 contributed to the 15.4% of variance and was primarily associated with number of productive tiller (loading = 0.871) and plant height (loading = 0.514) [Tables 4 and 5].
Table 3: Kaiser–Meyer–Olkin (KMO) and Bartlett’s test.
| KMO measure of sampling adequacy | 0.626 | |
| Bartlett’s test of sphericity | Approx. Chi-square | 516.032 |
| d.f. | 28 | |
| Sig. | <0.001 | |
*-Significant (P<0.05).
 | Figure 1: Principal component versus eigenvalues. [Click here to view] |
Table 4: Total variance explained.
| Rotation sums of squared loadings | Component 1 | Component 2 | Component 3 |
|---|---|---|---|
| Eigen value | 2.261 | 1.267 | 1.235 |
| Percentage of variance | 28.259 | 15.836 | 15.443 |
| Cumulative percentage | 28.259 | 44.095 | 59.538 |
Table 5: Relationship between agronomic traits and principal components.
| Principal components | Correlation coefficient values | Variables |
|---|---|---|
| Component 1 | 0.904 | No. of filled spikelets per panicle |
| 0.895 | No. of spikelets per panicle | |
| 0.466 | Panicle length (cm) | |
| 0.425 | Primary branching number per panicle | |
| Component 2 | 0.847 | No. of productive tillers per plant |
| 0.575 | Plant height (cm) | |
| Component 3 | 0.773 | 1,000 seed weight (gm) |
| 0.572 | Leaf area ( L/A cm2) |
4. CONCLUSION
The M5 generation demonstrated a notable reduction in plant height compared to the control plants, consistent with observations from the M4 generation. In addition, yield-related traits, including panicle length, number of filled grains, and 1,000-seed weight, met the expected values. These traits are anticipated to reach stability in the upcoming M6 generation.
5. ACKNOWLEDGMENT
We want to express our heartfelt gratitude to the Department of Botany and the Head of the Botany Department at DDU Gorakhpur University, U.P., for their unwavering guidance and support throughout our study. Their insights and encouragement have been invaluable and have greatly contributed to the successful completion of our research.
6. AUTHORS’ CONTRIBUTIONS
All authors made substantial contributions to conception and design, acquisition of data, or analysis and interpretation of data; took part in drafting the article or revising it critically for important intellectual content; agreed to submit to the current journal; gave final approval of the version to be published; and agreed to be accountable for all aspects of the work. All the authors are eligible to be an author as per the International Committee of Medical Journal Editors (ICMJE) requirements/guidelines.
7. CONFLICTS OF INTEREST
The author reports no financial or any other conflicts of interest in this work.
8. ETHICAL APPROVALS
This study does not involve experiments on animals or human subjects.
9. DATA AVAILABILITY
All the data is available with the authors and shall be provided upon request.
10. PUBLISHER’S NOTE
All claims expressed in this article are solely those of the authors and do not necessarily represent those of the publisher, the editors and the reviewers. This journal remains neutral with regard to jurisdictional claims in published institutional affiliation.
11. USE OF ARTIFICIAL INTELLIGENCE (AI)-ASSISTED TECHNOLOGY
The authors declares that they have not used artificial intelligence (AI)-tools for writing and editing of the manuscript, and no images were manipulated using AI.
12. FUNDING
There is no funding to report.
REFERENCES
1. Mohidem NA, Hashim N, Shamsudin R, Che Man H. Rice for food security:Revisiting its production, diversity, rice milling process and nutrient content. Agriculture. 2022;12:741. [CrossRef]
2. Zhao M, Lin Y, Chen H. Improving nutritional quality of rice for human health. Theor Appl Genet. 2020;133:1397-413. [CrossRef]
3. Shi J, An G, Weber AP, Zhang D. Prospects for rice in 2050. Plant Cell Environ. 2023;46:1037-45. [CrossRef]
4. Bin Rahman AR, Zhang J. Trends in rice research:2030 and beyond. Food Energy Sec. 2023;12:e390. [CrossRef]
5. Durand-Morat A, Mulimbi W. International rice outlook:International rice baseline projections 2023-2033. AAES Res Rep Res Bull. 2024;1015:4-21.
6. Yadav S, Kumar V. Feeding the world while caring for the planet. Dir Seed Rice Cons Newsl. 2018;1:3-4.
7. Singh DP, Chandra V, Tiwari T. Evaluation of different Kalanamak rice genotypes for yield and yield related traits of eastern Uttar Pradesh. Int J Chem Stud. 2020;9:97-101. [CrossRef]
8. Kumar S, Pandey ID, Rather SA, Rewasia H. Genetic variability and inter-trait association for cooking and micronutrient (Fe&Zn) traits in advance lines of Kalanamak aromatic rice. JAPS J Anim Plant Sci. 2019;29:467-75.
9. Rajendran V, Sivakumar HP, Marichamy I, Sundararajan S, Ramalingam S. Phytonutrients analysis in ten popular traditional Indian rice landraces (Oryza sativa L.). J Food Meas Charact. 2018;12:2598-606. [CrossRef]
10. Ghosh SC, Dasgupta T. Medicinal health benefits of traditional rice (Oryza sativa L.). SATSA Mukh. 2023;27:243-52.
11. Chaudhary RC, Sahani A, Mishra SB. Gem from local germplasm of Kalanamak rice for environment, health and wealth. Int J Multidisc Res Grwth Eval. 2022;03:427-32.
12. Jayasri V, Chakraborty NR. Mutagenesis-a tool for improving rice landraces. In:Plant Mutagenesis:Sustainable Agriculture and Rural Landscapes. Switzerland, Cham:Springer Nature;2024. 199-205. [CrossRef]
13. Gowthami R, Vanniarajan C, Souframanien J, Veni K, Renganathan VG. Efficiency of electron beam over gamma rays to induce desirable grain-type mutation in rice (Oryza sativa L.). Int J Radiat Biol. 2021;97:727-36. [CrossRef]
14. Andrew-Peter-Leon MT, Ramchander K, Kumar K, Muthamilarasan M, Pillai MA. Assessment of efficacy of mutagenesis of gamma-irradiation in plant height and days to maturity through expression analysis in rice. PLoS One. 2021;16:e0245603. [CrossRef]
15. Food and Agriculture Organization of the United Nations/International Atomic Energy Agency-Mutant variety database (FAO/IAEA-MVD). Available from: https://www.iaea.org/resources/databases/mutant-varities-database [Last accessed on 2024 Dec 01].
16. Sao R, Sahu PK, Patel RS, Das BK, Jankuloski L, Sharma D. Genetic improvement in plant architecture, maturity duration and agronomic traits of three traditional rice landraces through gamma ray-based induced mutagenesis. Plants (Basel). 2022;11:3448. [CrossRef]
17. Mishra T, Singh A, Madhukar VK, Verma AK, Mishra S, Chauhan RS. Assessment of morpho-agronomic and yield attributes in gamma-irradiated mutants of Kalanamak rice (Oryza sativa L.). J Appl Biol Biotech. 2023;11:106-10. [CrossRef]
18. Sao R, Sahu PK, Patel RS, Das BK, Jankuloski L, Sharma D. Genetic improvement in plant architecture, maturity duration and agronomic traits of three traditional rice landraces through gamma ray-based induced mutagenesis. Plants. 2022;11:3448. [CrossRef]
19. Christina M, Jones MR, Versini A, Mézino M, Le Mezo L, Auzoux S, et al. Impact of climate variability and extreme rainfall events on sugarcane yield gap in a tropical Island. Field Crops Res. 2021;274:108326. [CrossRef]