
1. INTRODUCTION
Type 2 diabetes (T2D) is a chronic disease which accounts to 4.2 million deaths annually [1] and is caused by complex interplay of genetic and environmental factors. Its prevalence is increasing and over 463 million people are suffering from diabetes worldwide [2]. International federation of diabetes has projected a staggering figure of 700 million affected people by 2045 if effective medical interventions would not be exercised [2].
Clinically, T2D is defined by blood hyperglycemia which is attributed to weak insulin signaling in peripheral tissues such as adipose, muscle, and liver accompanied by low insulin secretion from the pancreatic β-cells. Although T2D is associated with deregulation in glucose homeostasis, it has been recognized that glucose homeostasis is intricately linked with fat metabolism and insulin resistance (IR) in peripheral tissues could be due to excess body fat and abnormal blood cholesterol level. Hyperinsulinemia – a stage characterized by high insulin secretion by pancreas to compensate weak insulin signaling has been found to precede IR which eventually results into destruction of pancreatic β-cells due to physiological overload and results in onset of overt T2D.
As IR acts as a precursor of T2D, it is essential to characterize its molecular pathogenesis to identify suitable drug target for its effective treatment. In the present study, we have attempted to propose a system- and network-biology-based approach to address this issue and have come up with recommendations for some potential drug targets. The proposed approach is generic and can be used for any medical condition.
2. MATERIALS AND METHODS
2.1. Selection of Microarray Datasets
Genomic Expression Omnibus (GEO) at National Center for Biotechnology Information (NCBI) was searched for studies regarding normal glucose tolerant (NGT), insulin resistant (IR), and type 2 diabetics (T2D) and a total of 18 gene expression microarray datasets were selected. These datasets were generated by profiling gene expressions in various insulin-responsive tissues/cells: Subcutaneous adipose tissue (SAT), visceral adipose tissue (VAT), liver, peripheral blood mononuclear cells (PBMCs), skeletal muscle, arterial tissue, blood cells, pancreatic islets tissue, and granulosa cells. Two of the datasets were further split based on adipose depot and microarray platform that results into 20 datasets [Table 1].
Table 1: Microarray samples used in meta-analysis for IR and T2D.
| S. No | GEO series | Tissue | Place of study | Disease phenotype | |
|---|---|---|---|---|---|
| Insulin resistance (IR)/Type 2 diabetes (T2D) | Normal glucose tolerance (NGT) | ||||
| 1 | GSE6798 | Skeletal muscle | Department of Hematology in Roskilde Hospital, Roskilde, Denmark. | IR=16 | 13 |
| 2 | GSE15773 | Subcutaneous adipose tissue (SAT) and Visceral adipose tissue (VAT) | Department of molecular medicine at University of Massachusetts, Worcester, USA | IR=4 (SAT) | 5 (SAT) |
| 3 | GSE20950 | Subcutaneous adipose tissue (SAT) and Visceral adipose tissue (VAT) | Department of molecular medicine at University of Massachusetts, Worcester, USA. | IR=9 (SAT) | 10 (SAT) |
| 4 | GSE22309 [G1] | Skeletal Muscle | Department of Biostatistics at University of Alabama, Birmingham, USA | IR=20 | 20 |
| 5 | GSE22309 [G2] | T2D=15 | 20 | ||
| 6 | GSE26637 | Subcutaneous Adipose Tissue | Department of Institute for molecular medicine Finland (FIMM), University of Helsinki, Helsinki, Finland. | IR=5 (Fasting) | 5 (Fasting) |
| 7 | GSE34526 | Granulosa cells | Department of Zoology at University of Delhi, Delhi, India. | IR=16 (PCOS) | 12 (PCOS) |
| 8 | GSE36297 | Vastus Lateralis Muscle | Department of Hematology, Roskilde Hospital, Roskilde, Denmark. | IR=6 | 10 |
| 9 | GSE64567 | Fasted subcutaneous abdominal adipose tissue (FAT) | Department of Medicine at University of Texas, Health Sciences Center at San Antonio, San Antonio, Texas, USA. | IR=38 | 26 |
| 10 | GSE12643 | Skeletal muscle | Odense University Hospital, Odense, Denmark | T2D=10 | 10 |
| 11 | GSE9006 [GPL96] | Peripheral Blood Mononuclear Cells (PBMCs) | UTSW Medical Center, Dallas, TX, USA | T2D=24 | 12 |
| 12 | GSE9006 | T2D=24 | 12 | ||
| 13 | GSE13760 | Arterial tissue | Department of Hematology in Roskilde Hospital, Denmark. | T2D=10 | 11 |
| 14 | GSE15653 | Liver | Joslin Diabetes Center, M.A, USA | T2D=9 | 4 |
| 15 | GSE15932 | Blood | Department of surgery, Zhejiang University, Hangzhou, China. | T2D=8 | 8 |
| 16 | GSE19420 [G1] | Skeletal muscle vastus lateralis | Department of Genetics and Cell biology at Maastricht University, Maastricht, Netherlands. | T2D=12 | 12 |
| 17 | GSE19420 [G2] | T2D=18 | 12 | ||
| 18 | GSE23343 | Liver | Kanazawa University, Kanazawa, Japan | T2D=10 | 7 |
| 19 | GSE25724 | Pancreatic islets | Department of Endocrinology and Metabolism at University of Pisa, Pisa, Italy. | T2D=6 | 7 |
| 20 | GSE29221 | Skeletal Muscle | Department of Functional Genomics Unit at CSIR-Institute of Genomics and Integrative Biology (IGIB), Delhi, India | T2D=12 | 12 |
The gene expression microarray series GSE6798 was conducted by Skov et al. (2007) and they found impaired expression of genes involved in mitochondrial oxidative metabolism in skeletal muscle of women with PCOS and age- and BMI-matched normal women [3]. As IR is a clinical characteristic of PCOS, their study cued toward the possible association of oxidative metabolism with IR.
Hardy et al. (2012; GSE15773) attempted to unravel molecular pathways in obesity-associated insulin resistance in visceral and subcutaneous adipose depots [4]. They also conducted another study (GSE20950) with the same objectives but in morbidly obese IR individuals(BMI ≥ 40).
Wu et al. (2011; GSE22309) identified global insulin-responding genes in NGT individuals by maintaining euglycemia and identified genes, affecting resting energy expenditure and fuel partitioning in IR, and T2D individuals [5].
Soronen et al. (2012; GSE26637), in their study, maintained euglycemia in NGT and IR individuals and concluded that weak insulin signaling accounts to lower expression of genes involved in mitochondrial respiratory pathway and defective induction of lipid metabolism pathways [6].
Kaur S et al. (2012; GSE34526) investigated genes expression between NGT and PCOS women and found insulin resistance, a probable reason for infertility in the later [7].
Kristensen et al. (2014; GSE36297) showed that inherited insulin resistance coincides with the reduced mitochondrial oxidative capacity [8].
Winnier et al (2015; GSE64567) profiled gene expression in subcutaneous adipose tissue of 64 unrelated non-diabetic Mexican – American individuals due to high prevalence of obesity, IR, and T2D in this ethnic group [9]. We assigned that these samples in NGT and IR group on the basis of level of fasting plasma glucose (FPG) of each sample with >100 mg/dl FPG level have been considered as IR.
Frederiksen et al. (2008; GSE12643) found similar expression of genes involved in mitochondrial biogenesis in myotubes of NGT and T2D groups and, therefore, discounted it as a primary cause of IR or T2D [10].
Kaizer et al. (2007; GSE9006) identified the role of interleukin-1b and prostaglandins by immune effecter cells in beta-cell secretion in both T1D as well as T2D [11]. Their gene expression study in PBMCs of NGT and I2D also identified several targets for disease-modifying therapy of diabetes and potential biomarkers for monitoring treatment efficacy.
Skov et al. (2012; GSE13760) conducted a microarray study and identified several differentially regulated cellular pathways between NGT and T2D such as inflammation, insulin signaling, matrix metabolism, triglyceride synthesis, and apoptosis [12].
Pihlajamäki et al. (2009; GSE15653) identified novel transcriptional changes in human liver which could contribute to hepatic lipid accumulation and associated IR and T2D [13].
Van et al. (2012; GSE19420) identified that concluded that mitochondrial dysfunction in skeletal muscles could be apparent only in inactive long-standing T2D patients and not in those who have undergone a 52-week physical exercise training as per their study design. They concluded that mitochondrial function and insulin resistance do not depend on each other [14].
Misu et al. (2010; GSE23343) concluded that a liver-derived secretory protein could modulate the sensitivity/resistance of peripheral tissues to insulin similar to cytokines secreted by adipose tissue [15].
Dominguez et al. (2011; GSE25724) analyzed the differences in the transcriptome of T2D islets compared to NGT samples [16].
Jain et al. (2013; GSE29221) find that T2D-GWAS genes relate directly to insulin secretion and indirectly, through collaborating with other genes, to insulin resistance and supported the notion that environmentally triggered insulin resistance interacts with genetically programmed β-cell dysfunction to precipitate diabetes [17].
2.2. Identification of Meta-Genes
Package GEOquery [18] from R-Bioconductor was used to download series matrix files for each study. Meta-analysis has been carried out using web-based tool Network Analyst [19]. IR/NGT and T2D/NGT groups had been analyzed separately to obtain two meta-signatures of genes corresponding to each phenotype. To derive these meta-signatures, Fisher’s method was used on gene-level, log-transformed P-values after adjustment of batch size. Meta-genes were selected based on their log-transformed P-values (<0.05). Further, we identified common genes shared by both the disease phenotypes, that is, IR and T2D and database DisGeNET [20] which were searched against them to identify genes those have been already implicated to type 2 diabetes or its related phenotypes and this reduced set of genes was used for subsequent functional analysis.
2.3. Enrichment Analysis of Meta-Genes
To identify cellular pathways enriched by these genes, a Cytoscape app – ClueGO [21] was used against the human collection of WikiPathways that allow visualization of non-redundant pathway-terms in the form of network and, therefore, facilitates the interpretation of underlying biological theme.
2.4. Construction of Protein Interaction Network (PIN)
To further identify core genes in these pathways, we used a network biology approach. First, these pathways were imported as networks using WikiPathways app [22] and then combined using network-merge functionality of cytoscape.
This combined network comprised nodes representing proteins, mRNA, metabolites, complexes, small molecules, and other pathways. To compile a list of participating genes (proteins) from this network, STRING (Search Tool for the Retrieval of Interacting Genes/Proteins) database [23] was used and a protein interaction network (PIN) was derived.
2.5. Topological Analysis of PIN
The obtained PIN was subjected to topological analysis using CytoHubba app [24] for four nodes centralities: Degree (number of edges connected to a node), bottleneck (number of shortest paths going through a node), between-ness (number of times a node acts as a bridge along the shortest path between two other nodes), and MCC centrality (Maximal clique centrality – single node in a complex network determines connectivity of node to different cliques) and top 20 nodes for each centrality were selected.
3. RESULTS
Network-Analyst identified 2719 and 962 meta-genes (P < 0.05) for IR and T2D datasets, respectively, with 333 common genes shared by both phenotypes. These common genes were searched against DisGeNET database and 80 genes were found to be associated with T2D or its related phenotypes [Figure 1].
 | Figure 1: Venn diagram showing meta-signature genes of T2D and IR, 629 and 2386, respectively; common genes share between these two T2D and IR are 333 genes. [Click here to view] |
ClueGO analysis for these 80 genes against WikiPathways database reported highly suggestive 22 pathways, as shown in Figure 2.
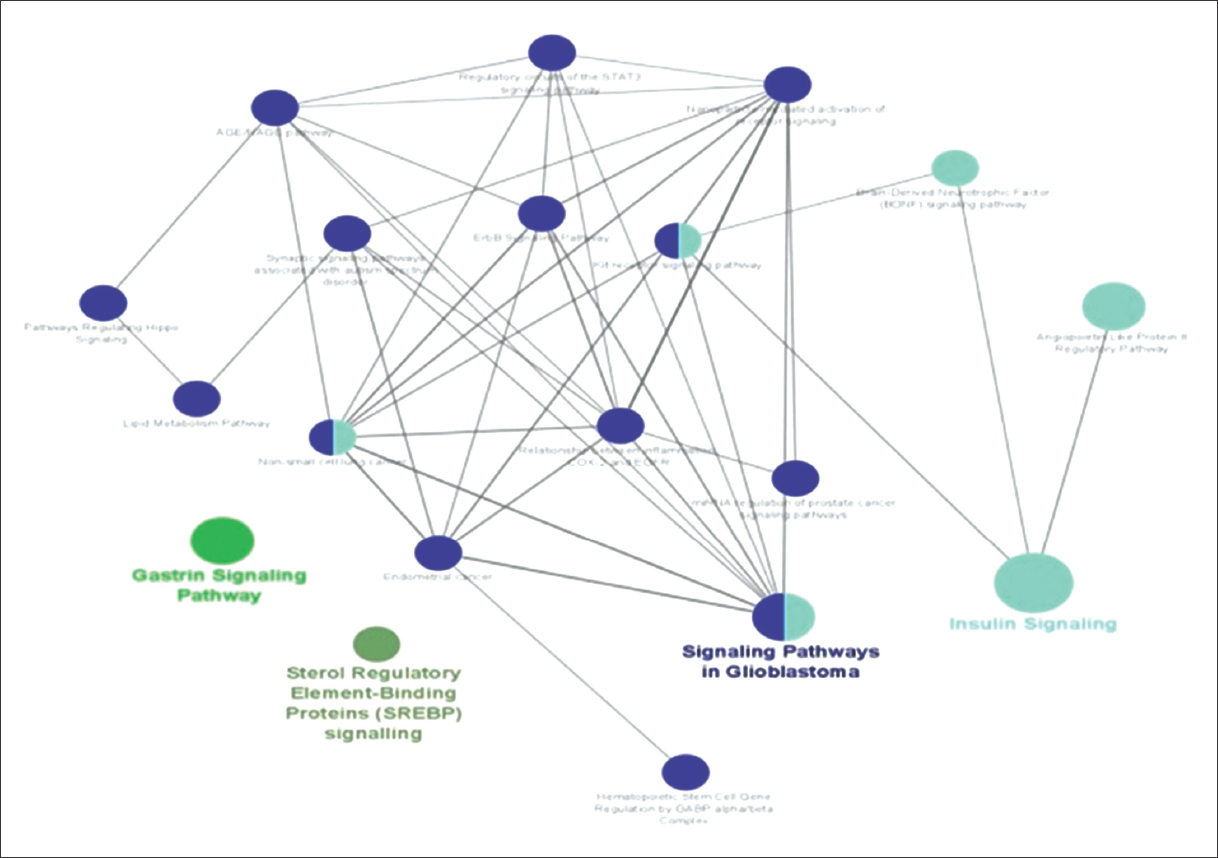 | Figure 2: Enriched Pathways inClueGO analysis. [Click here to view] |
To facilitate functional interpretation, CluGO also reported four major term-leading pathways [Table 2].
Table 2: Major terms leading pathway and genes involved in them.
| S. No. | Pathway Terms | Genes |
|---|---|---|
| 1 | Gastrin signaling pathway | CD44|EGFR|EGR1|FOXO3|JAG1|MAPK1|NFKBIA |
| 2 | Insulin signaling | AKT3|CBLB|EGFR|EGR1|EIF4E|FOXO3|INSR|MAPK1|NFKBIA|PPP2CA|PRKAB2|PRKCB|PTEN|RPS6KA3|SREBF2 |
| 3 | Signaling pathways in glioblastoma | AKT3|AR|CBLB|EGFR|FOXO3|IL6R|IL7R|INSR|MAPK1|MCL1|NFKBIA|PRKAB2|PRKAR1A|PRKCB|PTEN|RPS6KA3 |
| 4 | Sterol regulatory element binding protein (SREBP) signaling pathway | PRKAB2|SREBF2|YY1 |
We found association of Gastrin signaling pathway with T2D. Gastrin is a hormone which stimulates the proliferation of gastric mucosal cells. Incretins such as GIP (gastric inhibitory polypeptide) and GLP1 (glucagon like peptide 1) show indirect effect on pancreas [25]. Increased level of GRP (gastrin releasing peptide) has been reported to be associated with increased levels of pro-inflammatory cytokines and abnormal glucose metabolism [26].
Compensatory hyperinsulinemia in the setting of IR has been shown to activate Signaling Pathways in Glioblastoma. Glioblastoma is most frequent and aggressive tumor. Increased insulin levels promote tumor cell growth as tumor cells have INS receptors (IR) and insulin like growth factor 1 receptor (IFG1R) and both have mitogenic activities. The presence of insulin and hyperglycemia favors glioblastoma tumor progression and its absence degeneration of tumor growth [27]. Another pathway Sterol Regulatory Element Binding Protein (SREBP) signaling pathway is also relevant as SREBP regulates fatty acids and cholesterol synthesis and it has been found that elevated level of glucose uptake and insulin triggers the production of fatty acid in the liver by stimulating secretion of lipogenic enzymes in hepatocytes. Excess fatty acids/lipids accumulation in non-adipose tissues such as liver and skeletal muscle promotes lipotoxic state and results in insulin resistance [28].
Protein–protein interaction network of genes comprising these four core pathway was then created using STRING database which comprised 334 nodes, as shown in Figure 3.
 | Figure 3: STRING node network of 334 genes. [Click here to view] |
Topological analysis of nodes in this network was conducted by considering using CytoHubba app for four properties – degree node, bottleneck centrality, between-ness, and MCC [Figure 4] which reported 35 important proteins: VEGFA, MAPK1, SCD, EGFR, AKT1, SRC, PTEN, MYC, PRKCZ, IRS1, TP53, AKT3, JUN, KRAS, ARF1, MAPK3, CCND1, TSC2, MAP2K7, KIT, SREBF2, CDC42, MTOR, HRAS, SLC2A4, STAT3, CTNNB1, MAPK8, GSK3B, PIK3CA, CASP3, CDKN1A, BCL2L1, MDM2, and INSR1.
 | Figure 4: Top-20 enriched genes based on (a) degree, (b) between-ness (c) bottleneck, and (d) MCC. [Click here to view] |
4. DISCUSSION AND CONCLUSION
The present study undertook probably the largest meta-analysis of available gene expression data for identifying meta-signatures of T2D as well as its precursor IR. Earlier some of us conducted integrated meta-analysis of T2D, and IR microarray datasets and found enrichment of signaling pathways that those were likely cross-talking with each other and probably giving rise to diabetic phenotype [29]. We, further, conducted meta-analysis of adipose tissue specific IR-datasets and concluded, adiposopathy, a likely cause of IR [30]. It is not just the deposition of excessive fat but also its incorrect storage that was found to be responsible for these metabolic complications. Incorrect storage of peripheral fat particularly in Asian Indians due to small-sized peripheral compartment is also being recognized as an important indicator that confers this race more prone to T2D then their Caucasian counterparts [31]. Our data, further, dismiss the long held belief that subcutaneous abdominal fat is protective as we found no difference in gene expression between it and visceral fat [32].
Present T2D treatment is based on glucocentric mechanism and unable to correct the core pathogenic mechanisms of the disease. As T2D is a complex disease with substantial genetic component. therefore, its pathogenesis should encompass gene expression alterations.However, it is noteworthy that different genetic architectures could converge into two clinical indicators of the disease, namely, weak insulin signaling and relatively low insulin secretion. Clearly, it is the transcriptome that funnels different genetic mechanisms to the above-mentioned pathophysiological processes. The datasets that we have taken were belongs to different geographical locations and, hence, represent disparate genetic mechanisms that those were giving rise to common T2D-phenotypes. We, also, opined that there could be several genes shared by both IR and T2D and it seems highly likely that they might be involved in IR to T2D transition. Although T2D-associated genes are known, their potential interaction network is still unknown.
We, therefore, identified T2D-annotated genes which were also being shared by IR as well as those were also differentially expressed as evident by their presence in both the meta-signatures. To identify the pathways for these high-confidence genes; we adopted a network-based approach. Although canonical pathway databases KEGG, WikiPathways, Reactome, etc., present models to represent various signaling, metabolic, and gene regulatory processes, their data bias toward more studied processes such as cancer and infection which severely limits the capability of interpreting the meaning of gene set enrichment methods. Network-based approaches promise to rectify such issues.
In this work, we have identified 35 key proteins based on their topological properties in the protein–protein interaction network. These hub proteins may act as potential drug target for therapeutic interventions as they have been filtered through multiple funnels, namely, meta-analysis of gene expression datasets for IR and T2D, their association with T2D, and their topological positions. Four major cellular pathways governed by these meta-signature genes show their potential association with the diseases. The role of these pathways in T2D etiology has been supported with a large gene expression dataset. We expect that our identified genes can be validated by qPCR and/or western blot experiments and further investigated as their potential role in T2D and IR.
5. ACKNOWLEDGEMENT
AS is indebted to Head, Department of CEA, and Vice Chancellor, GLA University.
6. AUTHORS’ CONTRIBUTIONS
A.S. conceptualized the experimental design, A.S., N.M., and U.C. conducted the bioinformatics studies. S.M., U.R., and S.R. analyzed the results and carried out the manuscript writing. All authors reviewed the manuscript.
7. FUNDING
No funding has been received.
8. CONFLICTS OF INTEREST
The authors report no financial or any other conflicts of interest in this work.
9. ETHICAL APPROVALS
This study require no ethical approval as it was based on computational analysis of publically available data.
10. DATA AVAILABILITY
Data in the form of Supplementary Tables is available at publishers website.
11. PUBLISHER’S NOTE
This journal remains neutral with regard to jurisdictional claims in published institutional affiliation.
REFERENCES
1. Saeedi P, Salpea P, Karuranga S, Petersohn I, Malanda B, Gregg EW, et al. Mortality attributable to diabetes in 20-79 years old adults, 2019 estimates:Results from the International Diabetes Federation Diabetes Atlas, 9th edition. Diabetes Res Clin Pract 2020;162:108086. [CrossRef]
2. Saeedi P, Petersohn I, Salpea P, Malanda B, Karuranga S, Unwin N, et al. Global and regional diabetes prevalence estimates for 2019 and projections for 2030 and 2045:Results from the International Diabetes Federation Diabetes Atlas, 9th edition. Diabetes Res Clin Pract 2019;157:107843. [CrossRef]
3. Skov V, Glintborg D, Knudsen S, Jensen T, Kruse TA, Tan Q, et al. Reduced expression of nuclear-encoded genes involved in mitochondrial oxidative metabolism in skeletal muscle of insulin-resistant women with polycystic ovary syndrome. Diabetes 2007;56:2349-55. [CrossRef]
4. Hardy OT, Perugini RA, Nicoloro SM, Gallagher-Dorval K, Puri V, Straubhaar J, et al. Body mass index-independent inflammation in omental adipose tissue associated with insulin resistance in morbid obesity. Surg Obes Relat Dis 2011;7:60-7. [CrossRef]
5. Wu X, Wang J, Cui X, Maianu L, Rhees B, Rosinski J, et al. The effect of insulin on expression of genes and biochemical pathways in human skeletal muscle. Endocrine 2007;31:5-17. [CrossRef]
6. Soronen J, Laurila PP, Naukkarinen J, Surakka I, Ripatti S, Jauhiainen M, et al. Adipose tissue gene expression analysis reveals changes in inflammatory, mitochondrial respiratory and lipid metabolic pathways in obese insulin-resistant subjects. BMC Med Genomics 2012;5:9. [CrossRef]
7. Kaur S, Archer KJ, Devi MG, Kriplani A, Strauss JF 3rd, Singh R. Differential gene expression in granulosa cells from polycystic ovary syndrome patients with and without insulin resistance:Identification of susceptibility gene sets through network analysis. J Clin Endocrinol Metab 2012;97:E2016-21. [CrossRef]
8. Kristensen JM, Skov V, Petersson SJ, Ørtenblad N, Wojtaszewski JF, Beck-Nielsen H, et al. APGC-1a- and muscle fibre type-related decrease in markers of mitochondrial oxidative metabolism in skeletal muscle of humans with inherited insulin resistance. Diabetologia 2014;57:1006-15. [CrossRef]
9. Winnier DA, Fourcaudot M, Norton L, Abdul-Ghani MA, Hu SL, Farook VS, et al. Transcriptomic identification of ADH1B as a novel candidate gene for obesity and insulin resistance in human adipose tissue in Mexican Americans from the Veterans Administration Genetic Epidemiology Study (VAGES). PLoS One 2015;10:e0119941. [CrossRef]
10. Frederiksen CM, Højlund K, Hansen L, Oakeley EJ, Hemmings B, Abdallah BM, et al. Transcriptional profiling of myotubes from patients with type 2 diabetes:No evidence for a primary defect in oxidative phosphorylation genes. Diabetologia 2008;51:2068-77. [CrossRef]
11. Kaizer EC, Glaser CL, Chaussabel D, Banchereau J, Pascual V, White PC. Gene expression in peripheral blood mononuclear cells from children with diabetes. J Clin Endocrinol Metab 2007;92:3705-11. [CrossRef]
12. Skov V, Knudsen S, Olesen M, Hansen ML, Rasmussen LM. Global gene expression profiling displays a network of dysregulated genes in non-atherosclerotic arterial tissue from patients with type 2 diabetes. Cardiovasc Diabetol 2012;11:15. [CrossRef]
13. Pihlajamäki J, Boes T, Kim EY, Dearie F, Kim BW, Schroeder J, et al. Thyroid hormone-related regulation of gene expression in human fatty liver. J Clin Endocrinol Metab 2009;94:3521-9. [CrossRef]
14. van Tienen FH, Praet SF, de Feyter HM, van den Broek NM, Lindsey PJ, Schoonderwoerd KG, et al. Physical activity is the key determinant of skeletal muscle mitochondrial function in type 2 diabetes. J Clin Endocrinol Metab 2012;97:3261-9. [CrossRef]
15. Misu H, Takamura T, Takayama H, Hayashi H, Matsuzawa-Nagata N, Kurita S, et al. Aliver-derived secretory protein, selenoprotein P, causes insulin resistance. Cell Metab 2010;12:483-95. [CrossRef]
16. Dominguez V, Raimondi C, Somanath S, Bugliani M, Loder MK, Edling CE, et al. Class II phosphoinositide 3-kinase regulates exocytosis of insulin granules in pancreatic beta cells. J Biol Chem 2011;286:4216-25. [CrossRef]
17. Jain P, Vig S, Datta M, Jindel D, Mathur AK, Mathur SK, et al. Systems biology approach reveals genome to phenome correlation in type 2 diabetes. PLoS One 2013;8:e53522. [CrossRef]
18. Davis S, Meltzer PS. GEOquery:A bridge between the Gene Expression Omnibus (GEO) and BioConductor. Bioinformatics 2007;23:1846-7. [CrossRef]
19. Zhou G, Soufan O, Ewald J, Hancock RE, Basu N, Xia J. NetworkAnalyst 3.0:A visual analytics platform for comprehensive gene expression profiling and meta-analysis. Nucleic Acids Res 2019;47:W234-41. [CrossRef]
20. Piñero J, Bravo À, Queralt-Rosinach N, Gutiérrez-Sacristán A, Deu-Pons J, Centeno E, et al. DisGeNET:A comprehensive platform integrating information on human disease-associated genes and variants. Nucleic Acids Res 2017;45:D833-9. [CrossRef]
21. Mlecnik B, Galon J, Bindea G. Comprehensive functional analysis of large lists of genes and proteins. J Proteomics 2018;171:2-10. [CrossRef]
22. Kelder T, van Iersel MP, Hanspers K, Kutmon M, Conklin BR, Evelo CT, et al. WikiPathways:Building research communities on biological pathways. Nucleic Acids Res 2012;40:D1301-7. [CrossRef]
23. Szklarczyk D, Gable AL, Lyon D, Junge A, Wyder S, Huerta-Cepas J, et al. STRING v11:Protein-protein association networks with increased coverage, supporting functional discovery in genome-wide experimental datasets. Nucleic Acids Res 2019;47:D607-13. [CrossRef]
24. Chin CH, Chen SH, Wu HH, Ho CW, Ko MT, Lin CY. cytoHubba:Identifying hub objects and sub-networks from complex interactome. BMC Syst Biol 2014;8 Suppl 4:S11. [CrossRef]
25. Rehfeld JF. CCK, gastrin and diabetes mellitus. Biomark Med 2016;10:1125-7. [CrossRef]
26. Pendharkar SA, Drury M, Walia M, Korc M, Petrov MS. Gastrin-releasing peptide and glucose metabolism following pancreatitis. Gastroenterol Res 2017;10:224-34. [CrossRef]
27. Matsuzaka T, Shimano H, Yahagi N, Amemiya-Kudo M, Okazaki H, Tamura Y, et al. Insulin-independent induction of sterol regulatory element-binding protein-1c expression in the livers of streptozotocin-treated mice. Diabetes 2004;53:560-9. [CrossRef]
28. Jiang WJ, Peng YC, Yang KM. Cellular signaling pathways regulating b-cell proliferation as a promising therapeutic target in the treatment of diabetes (Review). Exp Ther Med 2018;16:3275-85. [CrossRef]
29. Saxena A, Sachin K, Bhatia AK. System level meta-analysis of microarray datasets for elucidation of diabetes mellitus pathobiology. Curr Genomics 2017;18:298-304. [CrossRef]
30. Saxena A, Sachin K. A network biology approach for assessing the role of pathologic adipose tissues in insulin resistance using meta-analysis of microarray datasets. Curr Genomics 2018;19:630-66. [CrossRef]
31. Saxena A, Tiwari P, Wahi N, Soni A, Bansiwal RC, Kumar A, et al. Transcriptome profiling reveals association of peripheral adipose tissue pathology with type-2 diabetes in Asian Indians. Adipocyte 2019;8:125-36. [CrossRef]
32. Kumar A, Tiwari P, Saxena A, Purwar N, Wahi N, Sharma B, et al. The transcriptomic evidence on the role of abdominal visceral vs. Subcutaneous adipose tissue in the pathophysiology of diabetes in Asian Indians indicates the involvement of both. Biomolecules 2020;10:E1230. [CrossRef]