
1. INTRODUCTION
Obesity is a multisystem disease that elevates the risk of the most common non-communicable chronic diseases of the 21st century [1,2]. Being overweight (OW), which encompasses a wide range of excess body fat, has emerged as a significant public health issue [3]. The influence of comorbidities grows in parallel with obesity [4]. The WHO reported that obesity and OW are significantly higher in the Eastern Mediterranean Region, which includes Egypt. The prevalence of OW and obesity in this region ranges from 74% to 86% among females and 69% to 77% among males [5]. A definite problem in Egypt is that the disparity in obesity is twice as high for females as for males [6,7].
Iron (Fe) is a vital mineral that plays a meaningful role in cellular respiration, DNA synthesis, and cell proliferation [8]. Wenzel et al. were considered the first team to detect lower serum Fe values in obese patients compared to the control group [9]. Some authors noted a decrease in serum Fe levels and transferrin saturation in the OW group compared to the control group [10]. Furthermore, Manios et al. stated that ferritin levels are elevated in obese children (9–13 years old) [11]. Other scientists demonstrated lower Fe levels and transferrin saturation and higher hepcidin levels for the obese group compared to the control [12]. The recent rise in obesity-related chronic inflammatory conditions, along with the involvement of hepcidin, has been of considerable value [13]. Obesity boosts the levels of the Fe regulating hormone hepcidin, which can lead to a misdistribution of Fe in the body, which may play a role in metabolic disorders [14] where hepcidin controls the expression of ferroportin (Fe transporter) in target cells [15].
The choice of successful obesity treatment depends on an accurate diagnosis. There are various approaches to dealing with obese patients in treatment, such as nutritional system, sport and exercise medicine, abscission solution, lifestyle change, pharmacotherapy drug, acupuncture, and herbal medicine [16].
Deferiprone, deferoxamine, and deferasirox drugs treated Fe overload in different diseases such as thalassemia and hemochromatosis. Deferiprone has common side effects: Agranulocytosis, neutropenia, musculoskeletal and joint pains, gastrointestinal complaints, and zinc deficiency. Deferoxamine side effects are bluish fingernails, lips, skin blurred vision or other vision problems, convulsions (seizures), difficulty breathing or rapid breathing, fast heartbeat, hearing problems, and redness of the skin. Deferasirox has limitations related to dose, toxicity, cost, and ineffective removal of excess Fe from the heart [17]. Eventually, goldenberry (GB) is a natural product and safe as a Fe chelator, and has no side effects.
New plants extracts of medicinal herbs have been identified to show their efficacy and role in weight loss [18]. GB (Physalis peruviana L.), also known as Harankash in Egypt, is a remarkable fruit with many medicinal and culinary applications. Puente et al. (2011) reported that the presence of several specific phytosterols: “Campesterol, β-sitosterol, and stigmasterol” lowers cholesterol levels in the blood, as they are found in high concentrations in oils derived from the fruit of P. peruviana L., offering them with antihypercholesterolemic properties and antioxidant. Moreover, high amounts of polyphenols as well as Vitamins A and C contribute to the antioxidant activity associated with this finding [19].
Our current study was conducted to verify the efficacy of GB (P. peruviana) fruit with husk extract as a novel nature’s safe dietary
2. MATERIALS AND METHODS
2.1. Plant Material
P. peruviana were collected from the market in Cairo, Egypt, during its season on February/March 2020. The identification of the plants was confirmed by “Herbarium of the Department of Botany, Faculty of Science, Cairo University. The voucher specimens (G3) were kept in the National Research Centre Herbarium, Cairo, Egypt.”
2.2. Preparation of Extract
The fresh fruits with their husk (5 kg) were washed in running tap water in the laboratory, vigorously swirled by the blender, then soaked in 70% MeOH, warmed at 40°C, and filtered (using Whatman No.1 filter paper) into another sterile container. Extraction processes were repeatedly done thrice at 40°C; then, the resulting liquid was collected, filtered, and reduced through evaporation under vacuum by a rotary evaporator (Heidolph, Germany) at 45°C and then the crude extract was placed in lyophilization to give a dry residue (60 g).
2.3. Phytochemical Screening
The concentrated methanolic extract of P. peruviana fruit was applied to a polyamide column and eluted with water followed by different ratios of water/methanol to give rise to five fractions, which were further purified by a series of fractionations on a Sephadex LH-20 column and preparative paper chromatography to afford five phenolic acids, namely, gallic acid, pHydroxy benzoic acid, caffeine, o-Coumaric acid, and cinnamic acid together with six flavonoids identified as the three aglycone naringenin, kaempferol, and apigenin with their glucosides derivatives, respectively. The structures of the isolated compounds have been established by conventional methods of chemical and physical analyses and were confirmed by 1H- and 13C-NMR spectroscopy.
2.4. Reagents
Folin–Ciocalteu and AlCl3 reagents were supplied by Sigma (St. Louis, MO) and were used as they were received.
2.5. Estimation of Total Phenolics and Flavonoid Contents
The total phenolic content (TPC) of P. peruviana fresh fruit with husk was determined using Folin–Ciocalteu colorimetric assay described by Saboo et al. [20] with minor modification, using gallic acid as a standard. The results were calculated using the standard curve of gallic acid with known concentrations (2.5–50 μg mL–1). The phenolic content was expressed as mg gallic acid equivalent (GAE)/g plant extract. Both sections’ total flavonoids content (TFC) was measured using AlCl3 colorimetric assay [21]. The total flavonoids concentration of the extract was determined according to the reported procedure [22]. TFC was expressed as mg rutin equivalent (RE)/g plant extract.
2.6. Animal Care and Treatments
Thirty-two adults female Wistar rats weighing 150–170 g (National Research Center, Animal house, Egypt) were stayed at stable room temperature (25°C) with a 12 h light/dark cycle and free access to food and water. The animals were left a week for adaptation. Eight rats were kept as control, and others were given a high-fat diet (HFD) and water from the tap with 25% sucrose for 12 weeks to develop obesity. HFD contains carbohydrate 42.3%, protein 17%, fat 22.50%, fiber 3%, 2%, minerals 5%, and moisture 10%. Normal rats were fed free standard chow pellets. The animal was handled following the recommendations of the National Institute of Health Guide for Care and Use of Laboratory
The rats were separated into four groups:
Group-I: Normal control rats served were fed a free standard chow diet.
Group-II: Rats were given a HFD and water from the tap with 30% sucrose for 12 weeks to develop an obesity model.
Group-III: Obese rats treated orally with a low dose of 200 mg/kg bodyweight (b.w) of GB extract for 8 weeks.
Group-IV: Obese rats treated orally with a high dose of 400 mg/kg b.w of GB extract for 8 weeks.
2.7. Anthropometric Measures
The b.w. (g) and nasal-anal length (NAL) (cm) of rats in the normal control group and experimental groups were assessed at the beginning of the experiment, as well as after 2, 4, 6, and 8 weeks. The circumference of the waist was measured. The body mass index (BMI) (g/cm2) was calculated according to the formula: “BMI = b.w. (g)/NAL (cm2)” Obesity was defined as a BMI of 0.68 g/cm2 or above, as previously reported by Novelli et al. [23].
2.8. Samples Collection
After the therapy period, the rats of all groups were fasted for about 10 h. Blood samples were collected from a retro-orbital vein under local anesthesia by phenobarbital, and separated plasma was stored in Eppendorf tubes at −30°C for biochemical analysis.
Immediately after blood sampling, animals were sacrificed by cervical dislocation and the adipose tissue was collected to measure biochemical parameters and trace elements.
2.9. Lipid Profile Determination
The lipid profile was evaluated calorimetrically using serum determination kits from “Salucea Company, The Netherlands.” The lipid profile included total cholesterol (TC), triglyceride (TG), low-density lipoprotein (LDL), and high-density lipoprotein (HDL).
2.10. Adiponectin and Leptin Determination
Rat adiponectin and leptin were quantified by enzyme-linked immunosorbent assay (ELISA) in plasma using “SinoGeneClon Biotech Co. Kit, China.”
2.11. Fe Profile Measurement
Plasma Fe and total Fe-binding capacity (TIBC) concentrations were determined quantitatively by Química Clínica Aplicada S.A. Kit [24,25]. Ferritin and transferrin receptor (TFR) were quantified in plasma by Sunlong Biotech Co. Kit.
2.12. Trace Element Analysis
Table 1 shows the operating conditions for the determination of Fe, Cu, and Zn ions using the Agilent 5100 Synchronous Vertical Dual View (SVDV) ICP-OES, with Agilent Vapor Generation Accessory VGA 77. All adipose tissue samples were digested with nitric acid before metal determination since it is an appropriate matrix for consistent recovery of metals suitable with the analytical technique (APHA, 2017) [26]. The Agilent 5100 Inductively Coupled Plasma-Optical Emission Spectrometer (ICP-OES) with SVDV was used for all heavy metal studies. A blank and three or more Merck Company standards were used to create an intensity calibration curve for each set of measurements (Germany). External reference standards from Merck, as well as standard reference material for trace elements in water and a quality control sample from the National Institute of Standards and Technology, were used to ensure the accuracy and precision of the instrument reading.
2.13. Rat Hepcidin Concentration (ELISA)
Plasma hepcidin concentration was determined quantitatively by Elabscience Biotechnology Kit from China.
2.14. Hepcidin Gene (HAMP) Expression
2.14.1. RNA isolation
RNA was extracted from the adipose tissue (using 50 mg) by QIAamp RNA Blood Mini kit (CAT#52304 QIAGEN). The concentration of RNA was determined using a nanophotometer and was reverse transcribed. The RNA content was obtained by measuring the A260/A280 ratio, which should be between 1.8 and 2.0.
2.14.2. Reverse transcription
cDNA was generated by the QuantiTect Reverse Transcription kit (CAT# 205311 QIAGEN). The manufacturer’s instructions were followed for setting up and running the reactions. Until used in RT-qPCR, samples were stored at −20°C. QuantiNova SYBR Green PCR kit (CAT#208052 QIAGEN) and QuantiTect primer assay (CAT#249900 QIAGEN) were used to perform qRT-PCR gene expression investigation.
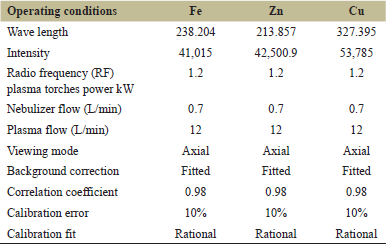 | Table 1: The operating conditions for the determination of iron, zinc, and copper ions using ICP-OES. [Click here to view] |
2.14.3. RT-qPCR
To determine fold change in gene expression, the fluorescence signals were analyzed with the Applied Biosystems Sequence Detection Software, and CT (cycle threshold), ΔCT, and ΔΔCT were computed using the 2-ΔΔCT technique. The rate of change in HAMP expression was determined using the GAPDH gene as a reference gene in this approach (housekeeping gene) [27].
2.15. Oscillator Strength
Hemoglobin oscillator strength was determined using a Cary UV/VIS dual-beam spectrophotometer (model 100 UV-VIS) made by Agilent Technologies, Australia, at room temperature (at 25 ± 1°C). The extinction coefficient was measured at wavelengths ranging from 310 to 700 nm, and oscillator strength per molar heme was computed using the formulae below:
Where, M is the mass of electron in gram; C is the velocity of light in cm/s; N = Avogadro’s number; e = the charge of the electron in e.s.u; no = the index of refraction of the solvent (water); ν = the frequency of light in s-1, and ε = the molar extinction coefficient obtained based on Briggsian logarithms [28].
2.16. Statistical Analysis
Values were stated as mean ± S.E., and the variances between groups were tested for significance using analysis of variance (ANOVA), followed by “Tukey-Kramer multiple comparisons test” by “GraphPad Prism version 8.0.2. For Windows, GraphPad Software, San Diego, California USA, www.graphpad.com.” The level of statistical significance was at P < 0.05.
3. RESULTS
3.1. Total Phenolics and Flavonoid Contents
The TPC and flavonoids contents (TFC) of P. peruviana fruit with husk extract are demonstrated in Table 2. TPC was calculated as GAE/g plant extract, and TFC was calculated as RE/g of dried extract.
3.2. Anthropometric Measures of Obese Rats
Figure 1 depicts the time-dependent alterations in b.w. and BMI in the four groups throughout 2, 4, 6, and 8 weeks. At the start of GB extract supplementation, there was a significant increase in b.w. and BMI in obese, low dose of GB (200 mg/kg b.w), and high dose (400 mg/kg b.w) of GB rats compared to the normal control group. In the 4–8 weeks period marked by observation of the opposite, there was a significant decrease in BMI of low dose of GB and high dose of GB rats compared to obese rats. Figure 2 shows the advanced changes in naso-anal length and waist in the four groups over the 2, 4, 6, and 8 weeks. This means that the BMI of the two GB administrated groups (low and high dose of GB) showed decreases in BMI values after cessation of the experiment (after 8 weeks GB oral administration) compared to the obese group, which showed an increase in BMI values by a highly significant difference (P < 0.05).
3.3. Effects of GB Supplementation on Lipid Profiles of Obese Rats
Table 3 shows the lipid profile of obese rats that took the GB supplement. This study observed a substantial increase in plasma TG levels and TC (P < 0.05) in obese rats compared to the normal control group. GB supplementation notably reduced the levels of plasma TC and TG in obese rats (P < 0.05), as shown in Table 3, along with significantly lowering the level of HDL cholesterol in obese rats (P < 0.05) compared to the normal control group. GB supplementation groups significantly improved HDL compared to obese rats (P < 0.05). The level of LDL cholesterol was significantly increased (P < 0.05) in obese rats compared to the normal control group. GB supplementation at a low or high dose significantly decreased the plasma LDL cholesterol level in obese rats (P < 0.05).
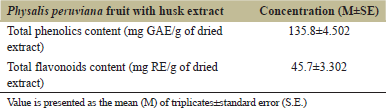 | Table 2: Total phenolics and flavonoids contents in Physalis peruviana fruit with husk extract. [Click here to view] |
3.4. Effect of GB Supplementation on Adiponectin and Leptin Hormones of Obese Rats
Adiponectin and leptin for the obese, obese + low dose of GB extract, and obese + high dose of GB extract groups as compared to control group illustrated in Figure 3. Adiponectin was significantly decreased in HFD rats compared with control rats (P < 0.05). Otherwise, leptin was significantly increased in obese rats in contrast to the normal control group. Differently, GB supplementation at low or high doses significantly increased adiponectin and decreased leptin levels compared to obese rats (P < 0.05).
3.5. Effect of GB Supplementation on Fe Overload of Obese Rats
The present results attained that the studied obese rats had a highly significant decrement (P < 0.05) in serum Fe and transferrin saturation levels as well as highly significant increases in ferritin, TIBC, and sTfR levels compared to the normal control group [Table 4]. Furthermore, the hepcidin hormone in plasma was significantly increased in obese rats compared with control rats. Administration of low or high dose of GB significantly improves hepcidin hormone compared with obese rats.
3.6. Effect of GB Supplementation on Trace Elements in Adipose Tissue of Obese Rats
Table 5 demonstrates the alterations in trace elements in adipose tissue of control and obese rats. A significant overload and elevation in Fe and copper levels correlated with a substantial reduction in the Zn level in adipose tissue. Oral administration of a low or high GB dose significantly decreased Fe and Cu while concurrently increasing Zn.
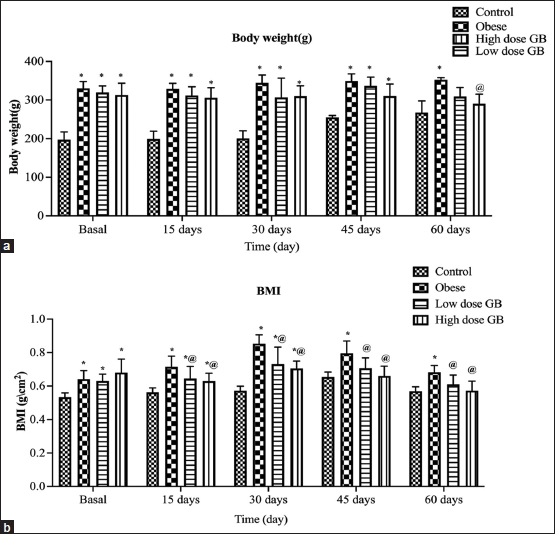 | Figure 1: Body weight variance over time (a) and BMI over time (b). Each bar represents the mean ± SE. Statistical analysis was conducted using one-way ANOVA followed by Tukey-Kramer multiple comparisons test for the respective time period. (*vs. control group and @vs. obese group) at P < 0.05. [Click here to view] |
 | Figure 2: Variation of the length of naso-anal with time (a) and waist with time (b). Each bar represents the mean±SE. Statistical analysis was conducted using one-way ANOVA followed by Tukey-Kramer multiple comparisons test for the respective time period. (*vs. control group and @vs. obese group) at P < 0.05. [Click here to view] |
 | Table 3: Lipid profile parameters of obese, obese+ low dose of GB extract, and obese+ high dose of GB extract groups compared to control. Each reading represents the mean±SE. [Click here to view] |
3.7. Effect of GB Supplementation on Hepcidin Expression in the Adipose Tissues of Obese Rats
Figure 4 illustrates the means fold change of HAMP expression in the adipose tissue samples of the studied groups that show significant upregulation (P < 0.05) in obese adipose tissue’s samples compared to control and significant downregulation (P < 0.05) in the adipose tissue samples with a low and high dose of GB when compared with the obese group.
3.8. Effect of GB Supplementation on Oscillator Strength of Hemoglobin (Hb) in Obese Rats
There was a dramatic increment in the oscillator strength per molar heme of obese rats in the normal control group. The opposite was clear as a highly significant decrement in rats subjected to either a low or high GB dose compared to obese rats [Table 6].
4. DISCUSSION
Obesity has emerged as a significant worldwide health issue, as it is associated with a slew of adverse health outcomes, including increased rates of cardiovascular morbidity and death [29]. Overfeeding causes obesity and obesity-related systemic inflammation, which can lead to dysmetabolic Fe overload syndrome (DIOS) and anemic inflammation (AI) [3]. Treatment of Fe overload induced by obesity with GB extract has not been previously documented. Therefore, this study targets to treat the Fe overload status caused by obesity and thus get rid of the most severe problems associated with obesity.
Anthropometric measures are a non-invasive and low-cost way of measuring the nutritional condition of rats and are widely recommended for the detection of obesity symptoms. In infancy and adulthood, waist circumference is a predictor of abdominal or visceral fat distribution, as well as insulin resistance, type 2 diabetes, dyslipidemia, and cardiovascular disease as hypertension [30]. However, it must be emphasized that this high-calorie diet resulted in fast weight gain in experimental animals. As a result, anthropometric measures of these animals have changed over time, including b.w. gain, NAL, waist circumference, and BMI. These findings were consistent with recent reports of comparable alterations [23,31,32].
Obese rats had considerably higher cholesterol, TGs, and LDL levels, whereas HDL levels were significantly lower. Our findings were compatible with prior studies [33,34]. Consumption of GB has been shown to have hypocholesterolemia-lowering effects in rats on a HFD. GB supplementation also appears to protect the liver from oxidative stress while reducing the amount of fatty liver that develops due to the HFD. It has been proposed that people with coronary atherosclerosis should take golden berries to prevent the condition from progressing. Minor components, such as flavonoids, effectively reduce LDL oxidation and platelet aggregation, and carotenoids, which are thought to function mainly as antioxidants, may potentially have beneficial benefits [35]. Supplementation of GB extract (fruit with husk) increased HDL cholesterol levels. Since HDL is involved in the transport of cholesterol from peripheral cells to the liver, high blood HDL cholesterol levels from dietary GB extract are believed to be beneficial in reducing the risk of cardiovascular disease. Our study of the fruit and husk as a single extract reveals the full extent of their anti-obesity potential.
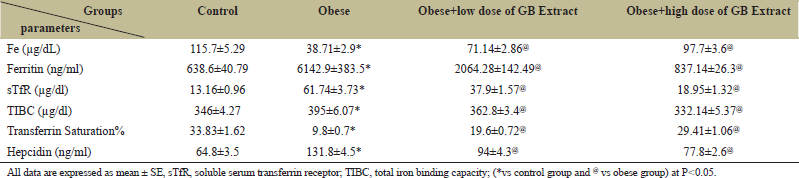 | Table 4: Iron status parameters of the Obese, Obese+low dose of GB extract, and Obese+high dose of GB extract groups compared to the control group. [Click here to view] |
 | Table 5: Changes in trace elements in the adipose tissue of Obese, Obese+low dose of GB Extract, and Obese+high dose of GB Extract groups compared to the control group. [Click here to view] |
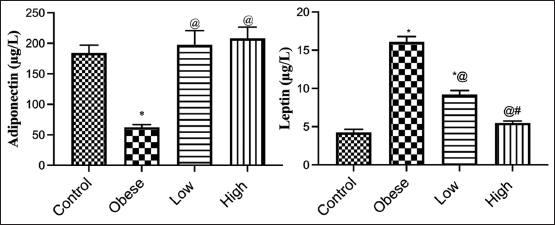 | Figure 3: Adiponectin and leptin for obese, obese + low dose of GB extract, and obese + high dose of GB extract groups in comparison with the control. Each bar represents the mean±SE. Statistical analysis was performed using one-way ANOVA followed by Tukey-Kramer multiple comparisons test for the respective time period. (*vs. control group, @vs. obese group, and #vs. low dose GB) at P < 0.05. [Click here to view] |
 | Figure 4: Fold change of hepcidin gene expression for obese, obese + low dose of GB extract, and obese+ high dose of GB extract groups compared to the control group. Each bar represents the mean±SE. Statistical analysis was performed using one-way ANOVA followed by Tukey-Kramer multiple comparisons test for the respective time period. (*vs. control group and @vs. obese group) at P < 0.05. [Click here to view] |
 | Table 6: Oscillator strength for Obese, Obese + low dose of GB Extract, and Obese + high dose of GB Extract groups compared to control group. [Click here to view] |
It has also been observed that the fruit from Physalis species is rich in Vitamins A, B, and C, making them very nutritious. A-carotene, β-carotene, and β-cryptoxanthin are the major active components of Vitamin A in fruits. Phytosterols are extremely important because of their antioxidant properties and their impact on total and LDL cholesterol [36].
Compared to the normal control group animals, rats fed a high fructose diet had a significant rise in blood leptin and a reduction in adiponectin levels. Administration of either a low or high dose of GB extracts dramatically reduced the increase in leptin levels to near-normal levels, as well as improved adiponectin levels. Our results agreed with previous research [37,38]. Because of the aberrant buildup and malfunction of adipose tissue, obesity is characterized by a wide range of circulating adipokine levels. Obesity problems, as well as an increased risk of obesity-related comorbidities, including type 2 diabetes, are linked to altered levels of leptin and adiponectin. In rat models, leptin and adiponectin are also indicators of metabolic syndrome. Leptin is a neuroendocrine and energy homeostasis regulator, reflecting energy reserves, fat mass, and energy deprivation.
The present results showed that the studied obese rats had highly significantly decreased serum Fe and transferrin saturation levels and significantly increased ferritin, TIBC, and sTfR levels compared with the normal control group. Fe deficiency is considered one of the most prevalent nutritional disorders worldwide by the WHO. Fe deficiency may occur if Fe supplement is reduced to meet our average nutritional needs. Some medical studies have concluded that there is a negative relationship between Fe levels and BMI. However, the serum Fe concentration in the obese group was lower than that of the normal control group, which agreed with those in several other studies [39-41]. Lower serum Fe concentrations can be clarified by the fact that plasma lipid in obesity can increase the expression of the hepatic bactericidal protein, which can inhibit intestinal Fe uptake and macrophages in the release of hemoglobin Fe [42-45]. Since serum ferritin is an acute-phase reactant in addition to an inflammatory condition, it may prevent Fe mobilization from reticuloendothelial storage, showing Fe excess and transferrin saturation below 20%, indicating Fe insufficiency [46]. Surprisingly, fruit with husk GB extract, which has not been documented before, contains high levels of TPC and flavonoid content as kaempferol, a potent reactive scavenger, and provides promising results chelating effects for Fe overload. Meanwhile, they also interacted with Fe to enhance Fe excretion rates.
Despite appropriate dietary Fe consumption, obesity is associated with hypoferremia, decreased Fe absorption, and reduced Fe storage in adults and children [47]. Hepcidin is a hormone that regulates body Fe homeostasis and is produced by the liver. Elevation of serum hepcidin inhibits ferroportin-mediated Fe export from macrophages and enterocytes in the duodenum, leading to hypoferremia and reduced dietary Fe absorption. Total body fat predicts increased serum hepcidin in OW and obese subjects (OW/OB), which may disrupt Fe homeostasis and increase the risk of Fe deficiency [48].
As a response to increased Fe reserves in the body, hepcidin is produced to prevent the absorption of additional Fe. Hepcidin production is substantially boosted by inflammation or Fe excess [49]. It was discovered that with extreme obesity, HAMP expression increases in adipose tissue. This rise is attributed to the chronic and continuous inflammatory stimulation in the obese state [50-52]. The quantitative expression levels of hepcidin mRNA in adipose tissue and plasma hepcidin concentration were substantially improved (P ≤ 0.05) in the groups treated with GB extract compared to the obese group. As a result, more Fe is transported to the plasma by the Fe transporter ferroportin, improving anemia, and preventing Fe overload in fatty tissues. This investigation was in line with several other studies [12,53,54]. The organism modulates intestinal Fe absorption, uptake, and mobilization from storage to meet the body’s Fe needs by regulating hepcidin production [55,56].
Another significant conclusion of our research is that Hb oscillator strength is a unique biophysical parameter that represents the entire light absorption of an Hb electronic transition. It offers quantitative information on the heme group’s electrical states. This parameter’s substantial rise in obese rats verifies alterations in the heme electronic structure and emphasizes hemoglobin’s macromolecular instability. Then, the instability could be related to the percentage of oxidized Hb and the degree of oxidation rather than oxygenation. This result is attributed to a disturbance in the levels of Fe2+, Cu2+, and Zn2+ observed in this study [57]. Furthermore, ferric compounds resulting from obesity are expected to be paramagnetic [58], and the presence of one or more of them tends to form higher values of oxyhemoglobin oscillation strength since the ferric atom in any form of chemical binding has an odd number of electrons. It seems to be related to methemoglobin percentage or sulfhemoglobin, that is, degree of oxidation rather than oxygenation. Not surprisingly, the observed significant decrease in the oscillator strength values in rats undergoing GB extract at different doses (200 and 400 mg/kg b.w.) was attributed to the role of GB extract, which has the potential to improve oxidative homeostasis of some trace elements induced by obesity in adipose tissue. Moreover, GB contains a large amount of Vitamin C, which acts as a powerful antioxidant. GB also possesses a ferric reducing antioxidant power which is based on electron transfer reactions [59]. Thus, it converts methemoglobin to oxyhemoglobin, confirming the stability of hemoglobin as a folding process.
5. CONCLUSION
Ultimately, the Egyptian GB (P. peruviana L.) boasts a high quality and quantity of nutrients and probiotics, with a lot of potential as a functional food. GB feeding was an effective intervention in ameliorating Fe overload in adipose tissues, redox balance of trace elements in obese rats, and suppressing fat accumulation. Furthermore, there is an upward assessment of the role of GB as a natural Fe chelator. Moreover, it counteracts oxidative stress, improving blood hemoglobin spin state, which reflects on its function and recovers the conformational structure of hemoglobin and its function as a macromolecule.
6. ACKNOWLEDGMENTS
The authors thank and appreciate the National Research Centre of Egypt for funding and technical support of this work.
7. AUTHOR CONTRIBUTIONS
All authors made substantial contributions to conception and design, acquisition of data, or analysis and interpretation of data; took part in drafting the article or revising it critically for important intellectual content; agreed to submit to the current journal; gave final approval of the version to be published; and agree to be accountable for all aspects of the work. All the authors are eligible to be an author as per the international committee of medical journal editors (ICMJE) requirements/guidelines.
8. FUNDING
This study is financially supported by National Research Centre, Egypt.
9. CONFLICTS OF INTEREST
The authors report no financial or any other conflicts of interest in this work.
10. DATA AVAILABILITY
All data generated and analyzed are included within this research article.
11. PUBLISHER’S NOTE
This journal remains neutral with regard to jurisdictional claims in published institutional affiliation.
REFERENCES
1. Kinlen D, Cody D, O’Shea D. Complications of obesity. QJM An Int J Med 2018;111:437-43. CrossRef
2. Mafort TT, Rufino R, Costa CH, Lopes AJ. Obesity: Systemic and pulmonary complications, biochemical abnormalities, and impairment of lung function. Multidiscip Respir Med 2016;11:28. CrossRef
3. Flegal KM. Prevalence and trends in obesity among US adults, 1999-2000. JAMA 2002;288:1723. CrossRef
4. Dietz WH, Robinson TN. Clinical practice. Overweight children and adolescents. N Engl J Med 2005;352:2100-9. CrossRef
5. Riley L, Guthold R, Cowan M, Savin S, Bhatti L, Armstrong T, et al. The World Health Organization STEPwise approach to noncommunicable disease risk-factor surveillance: Methods, challenges, and opportunities. Am J Public Health 2016;106:74-8. CrossRef
6. Ellabany E. STEPwise Approach to Chronic Disease Risk Factor Surveillance. Geneva: WHO; 2016.
7. Salazar-Martinez E, Allen B, Fernandez-Ortega C, Torres-Mejia G, Galal O, Lazcano-Ponce E. Overweight and obesity status among adolescents from Mexico and Egypt. Arch Med Res 2006;37:535-42. CrossRef
8. Abbaspour N, Hurrell R, Kelishadi R. Review on iron and its importance for human health. J Res Med Sci 2014;19:164-74.
9. Wenzel B, Stults H, Mayer J. Hypoferræmia in obese adolescents. Lancet 1962;280:327-8. CrossRef
10. Zhao L, Zhang X, Shen Y, Fang X, Wang Y, Wang F. Obesity and iron deficiency: A quantitative meta-analysis. Obes Rev 2015;16:1081-93. CrossRef
11. Manios Y, Moschonis G, Chrousos GP, Lionis C, Mougios V, Kantilafti M, et al. The double burden of obesity and iron deficiency on children and adolescents in Greece: The healthy growth study. J Hum Nutr Diet 2013;26:470-8. CrossRef
12. del Giudice EM, Santoro N, Amato A, Brienza C, Calabrò P, Wiegerinck ET, et al. Hepcidin in obese children as a potential mediator of the association between obesity and iron deficiency. J Clin Endocrinol Metab 2009;94:5102-7. CrossRef
13. González-Domínguez Á, Visiedo-García FM, Domínguez-Riscart J, González-Domínguez R, Mateos RM, Lechuga-Sancho AM. Iron metabolism in obesity and metabolic syndrome. Int J Mol Sci 2020;21:E5529. CrossRef
14. Heslin AM, O’Donnell A, Buffini M, Nugent AP, Walton J, Flynn A, et al. Risk of iron overload in obesity and implications in metabolic health. Nutrients 2021;13:1539. CrossRef
15. Knutson MD, Oukka M, Koss LM, Aydemir F, Wessling-Resnick M. Iron release from macrophages after erythrophagocytosis is up-regulated by ferroportin 1 overexpression and down-regulated by hepcidin. Proc Natl Acad Sci USA 2005;102:1324-8. CrossRef
16. Apovian CM, Aronne LJ, Bessesen DH, McDonnell ME, Murad MH, Pagotto U, et al. Pharmacological management of obesity: An endocrine society clinical practice guideline. J Clin Endocrinol Metab 2015;100:342-62. CrossRef
17. Kontoghiorghe CN, Kontoghiorghes GJ. Efficacy and safety of iron-chelation therapy with deferoxamine, deferiprone, and deferasirox for the treatment of iron-loaded patients with non-transfusion-dependent thalassemia syndromes. Drug Des Devel Ther 2016;10:465. CrossRef
18. Negi H, Gupta M, Walia R, Khataibeh M, Sarwat M. Medicinal plants and natural products, more effective and safer pharmacological treatment for the management of obesity. Curr Drug Metab 2021;22:918-30. CrossRef
19. Puente LA, Pinto-Muñoz CA, Castro ES, Cortés M. Physalis peruviana Linnaeus, the multiple properties of a highly functional fruit: A review. Food Res Int 2011;44:1733-40. CrossRef
20. Saboo S, Tapadiya R, Khadabadi SS, Deokate U. In vitro antioxidant activity and total phenolic, flavonoid contents of the crude extracts of Pterospermum acerifolium Willd leaves (Sterculiaceae). J Chem Pharm Res 2010;2:417-23.
21. Mandal B, Madan S. Preliminary phytochemical screening and evaluation of free radical scavenging activity of stevia rebaudiana bertoni from different geographical sources. J Pharmacogn Phytochem 2013;2:14-9.
22. Kumaran A, Karunakaran RJ. In vitro antioxidant activities of methanol extracts of five Phyllanthus species from India. LWT Food Sci Technol 2007;40:344-52. CrossRef
23. Novelli EL, Diniz YS, Galhardi CM, Ebaid GM, Rodrigues HG, Mani F, et al. Anthropometrical parameters and markers of obesity in rats. Lab Anim 2007;41:111-9. CrossRef
24. Tobacco, A., Moda, E., TarlI, P. & Veri, P. Colorimetric test for iron. Clinica, Chimica Acta 1981; 114: 287-90. CrossRef
25. Kunesh JP, Small LL. Adaptation of the zak-epstein automated micromethod for serum iron to determine iron-binding capacity and urinary iron. Clin Chem 1970;16:148-9. CrossRef
26. Association AP, Baird R, Eaton AD, Rice EW, Bridgewater L, Association AW, et al. Standard Methods for the Examination of Water and Wastewater; 2017.
27. Livak KJ, Schmittgen TD. Analysis of relative gene expression data using real-time quantitative PCR and the 2(-delta delta C(T)) method. Methods 2001;25:402-8. CrossRef
28. Takizawa N, Horie S. The oscillator strengths of hemoproteins. Their relation to the coordination structure and magnetic susceptibility. J Biochem 1986;100:221-32. CrossRef
29. Xia JY, Lloyd-Jones DM, Khan SS. Association of body mass index with mortality in cardiovascular disease: New insights into the obesity paradox from multiple perspectives. Trends Cardiovasc Med 2019;29:220-5. CrossRef
30. Ball GD, Huang TT, Cruz ML, Shaibi GQ, Weigensberg MJ, Goran MI. Predicting abdominal adipose tissue in overweight Latino youth. Int J Pediatr 2006;1:210-6. CrossRef
31. Mutiso SK, Rono DK, Bukachi F. Relationship between anthropometric measures and early electrocardiographic changes in obese rats. BMC Res Notes 2014;7:931. CrossRef
32. Shabbir F, Khan S, Yousaf MJ, Khan MA, Rajput TA. Comparison of effect of high fat diet induced obesity and subsequent atorvastatin administration on different anthropometric measures in sprague dawley rats. PAFMJ 2016;66:699-704.
33. Hassan SM, El-Kholie EM, Khedr AM. Anti-obesity effect of gooseberry (physalis peruviana) fruits in-induced obese rats. J Specif Educ Stud Res 2019; 1: 155-170.
34. Jiang H, Zhang W, Li X, Xu Y, Cao J, Jiang W. The anti-obesogenic effects of dietary berry fruits: A review. Food Res Int 2021;147:110539. CrossRef
35. Ramadan MF. Physalis peruviana pomace suppresses high-cholesterol diet-induced hypercholesterolemia in rats. Grasasyaceites 2012;63:4. CrossRef
36. Wu SJ, Tsai JY, Chang SP, Lin DL, Wang SS, Huang SN, et al. Supercritical carbon dioxide extract exhibits enhanced antioxidant and anti-inflammatory activities of Physalis peruviana. J Ethnopharmacol 2006;108:407-13. CrossRef
37. Al-Rasheed NM, Abdelkarem HM, Fadda LM, Mohamed AM, Al-Rasheed NM, Bassiouni Y, et al. Amelioration of insulin, leptin and adiponectin levels in experimental metabolic syndrome model by some drugs. Indian J Pharm Sci 2017;78:701-7. CrossRef
38. Stoica L, Gadea R, Navolan DB, Lazar F, Duta C, Stoian D, et al. Plasma ghrelin, adiponectin and leptin levels in obese rats with Type 2 diabetes mellitus after sleeve gastrectomy and gastric plication. Exp Ther Med 2021;21:264. CrossRef
39. Abo Zeid AA, El Saka MH, Abdalfattah AA, Zineldeen DH. Potential factors contributing to poor iron status with obesity. Alexandria J Med 2014;50:45-8. CrossRef
40. Jiao HT, Liu P, Lu WT, Qiao M, Ren XF, Zhang Z. Correlation study between simple obesity and serum concentrations of essential elements. Trace Elem Electrolytes 2014;31:53-9. CrossRef
41. Neymotin F, Sen U. Iron and obesity in females in the United States. Obesity 2011;19:191-9. CrossRef
42. Dambal SS, Indumati V, Kumari S. Relationship of Obesity with Micronutrient Status; 2011.
43. Nicolas G, Bennoun M, Devaux I, Beaumont C, Grandchamp B, Kahn A, et al. Lack of hepcidin gene expression and severe tissue iron overload in upstream stimulatory factor 2 (USF2) knockout mice. Proc Natl Acad Sci USA 2001;98:8780-5. CrossRef
44. Nicolas G, Bennoun M, Porteu A, Mativet S, Beaumont C, Grandchamp B, et al. Severe iron deficiency anemia in transgenic mice expressing liver hepcidin. Proc Natl Acad Sci USA 2002;99:4596-601. CrossRef
45. Fleming RE, Sly WS. Hepcidin: A putative iron-regulatory hormone relevant to hereditary hemochromatosis and the anemia of chronic disease. Proc Natl Acad Sci USA 2001;98:8160-2. CrossRef
46. Xuexi G. Analysis of trace elements in blood of preschool children with simple obesity in Shiyan city. China Nodern Doctor 2011;49:108-9.
47. Cepeda-Lopez AC, Allende-Labastida J, Melse-Boonstra A, Osendarp SJ, Herter-Aeberli I, Moretti D, et al. The effects of fat loss after bariatric surgery on inflammation, serum hepcidin, and iron absorption: A prospective 6-mo iron stable isotope study. Am J Clin Nutr 2016;104:1030-8. CrossRef
48. Sangkhae V, Nemeth E. Regulation of the iron homeostatic hormone hepcidin. Adv Nutr 2017;8:126-36. CrossRef
49. Ganz T. Hepcidin, a key regulator of iron metabolism and mediator of anemia of inflammation. Blood 2003;102:108-9. CrossRef
50. Bekri S, Gual P, Anty R, Luciani N, Dahman M, Ramesh B, et al. Increased adipose tissue expression of hepcidin in severe obesity is independent from diabetes and NASH. Gastroenterology 2006;131:788-96. CrossRef
51. Ganz T. Cellular iron: Ferroportin is the only way out. Cell Metab 2005;1:155-7. CrossRef
52. Nemeth E, Tuttle MS, Powelson J, Vaughn MB, Donovan A, Ward DM, et al. Hepcidin regulates cellular iron efflux by binding to ferroportin and inducing its internalization. Science 2004;306:2090-3. CrossRef
53. Panichsillaphakit E, Suteerojntrakool O, Pancharoen C, Nuchprayoon I, Chomtho S. The association between hepcidin and iron status in children and adolescents with obesity. J Nutr Metab 2021;2021:9944035. CrossRef
54. Rodríguez-Mortera R, Caccavello R, Hermo R, Garay-Sevilla ME, Gugliucci A. Higher hepcidin levels in adolescents with obesity are associated with metabolic syndrome dyslipidemia and visceral fat. Antioxidants 2021;10:751. CrossRef
55. Andrews NC. Forging a field: The golden age of iron biology. Blood 2008;112:219-30. CrossRef
56. de Domenico I, McVey Ward D, Kaplan J. Regulation of iron acquisition and storage: Consequences for iron-linked disorders. Nat Rev Mol Cell Biol 2008;9:72-81. CrossRef
57. Ramadan MF. Bioactive phytochemicals, nutritional value, and functional properties of cape gooseberry (Physalis peruviana): An overview. Food Res Int 2011;44:1830-6. CrossRef
58. Henninger B, Kremser C, Rauch S, Eder R, Zoller H, Finkenstedt A, et al. Evaluation of MR imaging with T1 and T2* mapping for the determination of hepatic iron overload. Eur Radiol 2012;22:2478-86. CrossRef
59. Briones-Labarca V, Giovagnoli-Vicuña C, Figueroa-Alvarez P, Quispe-Fuentes I, Pérez-Won M. Extraction of β-carotene, Vitamin C and antioxidant compounds from physalis peruviana (cape gooseberry) assisted by high hydrostatic pressure. Food Nutr Sci 2013;4:109-18. CrossRef