
2. INTRODUCTION
Escherichia coli K-12, B, C and W lineages are the most frequently used hosts in Biotechnology research and development cloning experiments as well as in industrial production [1,3,4,16,28].
According to the United States Environmental Protection Agency (US EPA) [29], Escherichia coli K-12 is considered a weakened microorganism as a result of having been maintained in the laboratory environment for more than 70 years. It is a GMO (Genetically Modified Organism) that belongs to risk group I, presenting a low individual risk, low risk to the community and which does not cause diseases to men or animals [7].
Industrial fermentation using lineages of Escherichia coli K-12 results in a low number of microorganisms released from the fermentation plant. The K-12 lineage does not survive long periods in soil, water or air and does not present known environmental survival mechanisms, such as the ability to produce spores [16]).
Methodologies that allow tracking the presence of Escherichia coli K-12 host differentiating it from other lineages of Escherichia coli in waste generated from industrial biotechnological processes are mandatory in Brazil [1,9,12,22,28]. Methods based on the identification of Escherichia coli K-12 DNA are described in the literature [1,16,28]. However, a large number of commercially available Escherichia coli K-12 strains, with phenotypic and genotypic variations, may cause substantial problems as regards the correct identification of their origins. Erroneous interpretation of experimental data in studies with Escherichia coli K-12 may generate a fuss as regards biosafety due to its proximity to wild and pathogenic lineages of other Escherichia coli [4,16].
The available techniques which allow the analysis of the genetic diversity of Escherichia coli lineages include genomic fingerprinting using repetitive element sequence-based PCR, such as REP-PCR (Repetitive Element Palindromic-Polymerase Chain Reaction) and ERIC-PCR (Enterobacterial Repetitive Intergenic Consensus-Polymerase Chain Reaction) [2,27,31].
Matrix Assisted Laser Desorption Ionization – Time of Flight (MALDI TOF MS) mass spectrometry is a robust method capable of rapidly identifying microorganisms. The identification is based on the protein profile obtained by MALDI TOF MS which combines the microbial sequences obtained with those available in databases, such as a proteomic fingerprint. This method has been rapidly expanded and successfully applied in the field of identification of microbial clinical specimens in European countries and North America, in a fast, stable and cost-effective way [15,24]. The use of MALDI TOF for the identification of different strains of Escherichia coli is described in the literature [10,15,17,25,26,32]. Thus, the purpose of the present study was to verify the ability of ERIC-PCR and MALDI-TOF methods to discriminate between different lineages of Escherichia coli strains including lineages of Escherichia coli K-12.
2. MATERIALS AND METHODS
2.1. Bacterial Lineages
The following lineages of Escherichia coli were used: Escherichia coli ATCC 8739, kindly provided by the Federal University of Minas Gerais, Brazil; Escherichia coli W3110, purchased from the Escherichia coli Stock Center of Yale University, USA; Escherichia coli DH5α, Escherichia coli BL21DE3+, Escherichia coli JM109, Escherichia coli MC 1061, kindly provided by the State University of Montes Claros, Brazil. Pure cultures of the microorganisms used were preserved in 20% glycerol and stored at -80°C. Culture reactivation was done on Tryptone Soy Agar (TSA, BD-Difco™, USA) medium prepared according to the manufacturer’s instructions.
2.2. Extraction of Genomic DNA
Colonies of the different Escherichia coli strains grown on Tryptone Soy Agar medium were transferred directly into microtubes and DNA extraction was performed with PrepMan™ Ultra Sample Preparation Reagent KIT (Thermo Fisher Scientific) according to manufactory instruction. The nucleic acids were quantified in NanoDrop and 50 ng of bacterial DNA was used for the ERIC-PCR reaction.
2.3. ERIC-PCR Assay and Statistical Analysis
Characterization of the genetic profile of Escherichia coli strains was performed using genomic DNA polymorphism analysis. Preserved ERIC-1 5’TGTAAGCTCCTGGGGATTAAC3’ and ERIC-2 5’AAGTAAGTGACTGGGGTGAGCG3‘ primers were used in PCR reaction for sequences of enterobacterial repetitive intergenic consensus described in the literature [11]. The reactions were carried out in a mix containing 2x Go taq Green Master Mix® (Promega, Corporation, USA), MgCl2 (2.5 mM), 10 μM of each primer and 50 ng of bacterial DNA in a final reaction volume of 50 μl. The amplification conditions were those described by Duan et al. (2009) [11]. The amplicons were visualized in 1.5% agarose gel stained with ethidium bromide and photo documented. The analysis of the amplification profiles was performed visually by two observers and transformed into binary data in a matrix, according to the presence (1) or absence (0) of bands. In order to evaluate the genetic relationship among Escherichia coli strains, the matrix was subjected to multivariate statistical analysis “Cluster Analysis” through the complete linkage method to calculate the Euclidean distance and generate a dendrogram using statistical software Minitab v. 1.6.
2.4. Bacteria Preparation for MALDI TOF Mass Spectrometry Analysis
For mass spectrometry analyzes using the MALDI TOF methodology, fresh bacterial colonies grown in Tryptone Soy Agar were used. Approximately 5 to 10 mg of cellular material was transferred from the plate with the presence of culture medium into a 1.5 ml extraction tube (Eppendorf) using a sterile inoculation loop. Cells were washed with 300 μl of deionized water (Sigma-Aldrich), 900 μl and ≥ 99.8% ethanol (Sigma-Aldrich) and centrifuged at 12000 rpm for 2 minutes. Subsequently, in order to extract ribosomal proteins, 50 μl of 70% formic acid (Sigma-Aldrich) and 50 μl of 50% acetonitrile (Sigma-Aldrich) were added to the decanted material. The decanted material was resuspended and centrifuged at 12000 rpm for 2 minutes. The supernatant was used for mass spectrometry analyzes. The organic solvent was prepared using 475 μl of deionized water, 25 μl of 99% trifluoroacetic acid (Sigma-Aldrich) and 500 μl of 50% acetonitrile (Sigma-Aldrich). The organic solvent was used for the preparation of a saturated solution of α-cyano-4-hydroxycinnamic acid (HCCA) with a concentration of 10 mg of HCCA/ml of organic solvent. For each biological material 1 μl of the bacterial cell, the lysate was deposited at a sample point of a MALDI plate (MSP 96 target, polished steel, Bruker Daltonics GmbH) and allowed to dry. Finally, 1 μl of the HCCA (α-cyano-4-hydroxycinnamic acid) matrix was deposited in the previously dried sample and allowed to dry at room temperature.
2.5. MALDI TOF Mass Spectrometry Analysis
The mass spectrum profiles were acquired using Microflex LT MALDI-TOF mass spectrometer (Bruker Daltonics GmbH) equipped with an N2 laser operating at a wavelength of 337 nm and frequency of 60 HZ. The positively charged intact proteins and peptides were electrostatically accelerated (at about 20 kV) in a 96-cm time-of-flight analyzer. The ions were measured in a positive linear model with instrument parameters optimized for the range of 2000 to 20,000 m/z.
Each measurement series was preceded by calibration and optimization of instrument parameters with Bacterial Test Standard (BTS) using FlexControl 3.4 software (Bruker Daltonics GmbH). This pattern is essentially a preparation of E. coli DH5α plus RNase (13.6 KDa) and Myoglobin (16.9 KDa) being these proteins in the upper mass range, which allows for calibration over a working range of 2 to 20 KDa. Maximum tolerable errors “Max. Std. Deviation (ppm)” were less than or equal to the 300-ppm required for the equipment to allow initiation of sample analysis.
Samples were acquired using FlexControl 3.4 software (Bruker Daltonics GmbH) and controlled and monitored in real time by MALDI Biotyper Realtime Classification software, MBT-RTC 4.0 (Bruker Daltonics GmbH). The resulting mass spectrum was then processed and the peak pattern compared to reference standards of the MALDI Biotyper 4.0 library (Bruker Daltonics GmbH). The result was then released through probability and identification.
The acquired spectra (controlled by MALDI Biotyper Realtime Classification software, MBT-RTC 4.0) were transformed into a peak list by means of a biostatistical algorithm. The obtained peak list was compared to the reference peak list of organisms in the reference library and a score value between 0 and 3.0 was generated. The algorithm considers three parameters for generating the score: a) frequency at which the peaks appear in library creation; b) relative intensity of peaks in the spectrum compared to the relative intensity of the library peaks and c) presence and absence of peaks in a range and error (<250 ppm, weight 1; >250 ppm and <600 ppm, weight 0.5) compared to peaks of the library. Scoring values ≥2.0 can be considered as high probability of species, values between 1.7 and 1.99 can be considered as high probability of gender and values <1.7, can be considered as unreliable identification.
For the visual comparison of the spectra, MALDI Biotyper 4.0 software was used (Offline Classification) and spectra that establish a relation of m/z (x-axis) versus intensity (y-axis) were generated. The assessment was based on the individual peaks in the set of spectra for the most prevalent peaks. The dendrogram was generated using Minitab 7.1 integrated with MALDI Biotyper 4.0 software. The “Euclidean Distance Measurement”, based on which the proximity relationship among organisms is reflected by an arbitrary distance level, was included in the parameter settings.
3. RESULTS AND DISCUSSION
Hybridization experiments with specifically targeted gene sequences to safely differentiate lineages of Escherichia coli strains, including Escherichia coli K-12, as well as sequencing of this genome, are described in the literature [1,4,5,16,28]. Published studies demonstrate results on the genetic identification of Escherichia coli K-12 in an industrial wastewater treatment effluent pond [28] and in industrial biotechnological process samples [1] based on Multiplex-PCR according to protocol described by Kuhnert et al. (1995) [16]. With the increasing advancement in contemporary methodologies based on a genomic and proteomic approach to identify microorganisms, it is possible to find competitive alternatives to determine the origin and differentiate the lineages of Escherichia coli strains. The Biotechnology industry where the study was carried out uses Escherichia coli W3110 lineage to produce a recombinant protein in accordance with all legal biosafety requirements. The development of advanced and competitive methodologies that differentiate Escherichia coli W3110 strain from wild and or pathogenic Escherichia coli is desirable in the concerned industry. Aiming at the elaboration of an alternative protocol for identification of Escherichia coli W3110, differentiating it from wild lineages, a total of 06 Escherichia coli strains were used in the genomic (ERIC-PCR) and proteomic (MALDI-TOF) analyzes of the present study. Among them, 04 Escherichia coli K-12 (DH5α, JM109, MC1061, W3110), 01 Escherichia coli strain derived from B cell (BL21DE3+) and 01 non-K-12 strain (Esherichia coli ATCC8730).
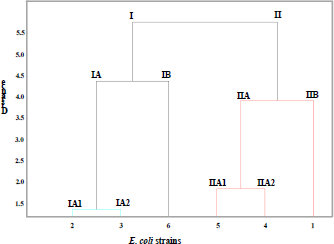
As a genomic strategy to differentiate the lineages of Escherichia coli strains, polymorphism analysis based on the ERIC repetitive element was performed using the ERIC-PCR technique resulting nine fragments of different sizes (Figure 1A). For fragment analysis, fragments in the range of 300 to 2000 base pairs were considered. The binary matrix created upon visual observation of the presence or absence of the fragments obtained after conduction of Cluster analysis/calculation of the Euclidean distance generated a dendrogram, in which the absence of genetic diversity among the strains is observed. The six Escherichia coli strains were divided into 2 different groups (I and II) without similarity among them (5.5 Euclidean distance value). In addition, according to the degree of similarity, it was possible to determine 04 different subgroups (IA and IB; IIA and IIB), revealing a different profile among the six Escherichia coli strains (Figure 1B). It was found profiles with 1.00 Euclidean distance value between Escherichia coli DH5α (IB1) and Escherichia coli JM109 (IB2) that belong to Group I. Escherichia coli W3110 (IA) shows 2,45 Euclidean distance value with Escherichia coli DH5α (IB1) and Escherichia coli JM109 (IB2) (Figure 1B). As these three Escherichia coli strain are considered as K12 E. coli lineage the ERIC PCR dendrogram results make sense. Escherichia coli MC1061 (genotype IIA), Escherichia coli BL21DE3 (genotype IIB1) and Escherichia coli ATCC 8739 were classified in Group II. The Euclidean distance obtained between groups IIA and IIB was close to 3.0. Although belonging to Group II, Escherichia coli ATCC 8739 (genotype IIB2) strain showed a significant genetic distance from the K-12 strains of such group (genotypes, IA, IB1, IIB1, and IIB2) (Figure 1B).
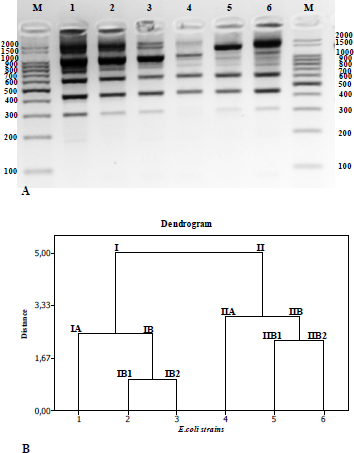 | Figure 1: Results of the analysis of the relationship among different strains of Escherichia coli by the ERIC-PCR technique. [Click here to view] |
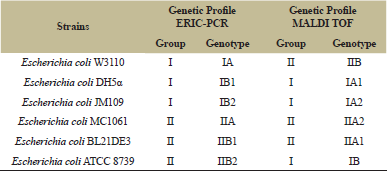 | Table 1: Comparison of genetic profiles of Escherichia coli strains according to dendrograms generated by ERIC-PCR and MALDI TOF analyzes. [Click here to view] |
Genetic diversity analysis by repetitive methods, including ERIC-PCR for Escherichia coli strains has been described in the literature [31]. The enterobacterial repetitive intergenic consensus (ERIC) region consists of a 127 bp imperfect palindromic sequence that occurs in the genome of enteric bacteria. Thirty copies of the ERIC sequence were found in the genome of Escherichia coli K-12 MG1655 in 29 different intergenic regions. This strain originated from a strain of Escherichia coli K-12 W3110 [31]. Versalovic et al. (1991) used the ERIC-PCR technique for genomic fingerprint analysis in different strains of Escherichia coli, including Escherichia coli W3110 [30]. The results revealed the difficulty of the technique in making fine interspecifically distinctions between Escherichia coli W3110 and Escherichia coli HBI1 strains. However, ERIC-PCR was able to reveal profile differences between pathogenic isolates of Escherichia coli and Shigella species.
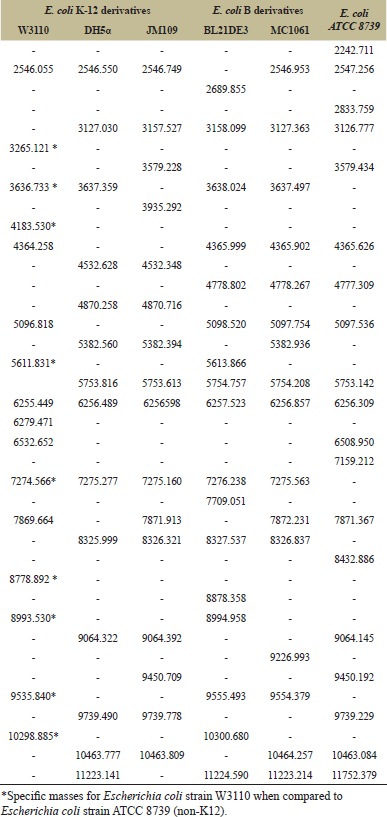 | Table 2: Observed masses generated from the peaks obtained by MALDI TOF analysis for Escherichia coli strains derived from K-12, Escherichia coli derived from B cells and Escherichia coli ATCC8739. [Click here to view] |
In our work, it was possible to consider the polymorphism analysis by ERIC-PCR, a tool capable of discriminating Escherichia coli ATCC 8739 from those E. coli k-12 strains here tested. However, ERIC-PCR has being reported in the literature with a low reproducibility method for Escherichia coli fingerprint [21,31].
MALDI TOF mass spectrometry analysis was performed as a proteomic strategy to differentiate the lineages of Escherichia coli strains. All six strains were confirmed at species level as Escherichia coli with a score higher than 2.0, corresponding to the parental reference Escherichia coli DH5α contained in the equipment database. For the analyzed strains, the range of mass peaks obtained was of approximately between 2,000 and 11,000 m/z, of which intraspecific similarities and distinctions are observed in Table 2 and Figure 2. The results obtained for the strains analyzed were similar to those already described for Escherichia coli strains [10,14,15,17,18,19,20,26,32]. The mass spectra obtained may be detectable under certain conditions and may be used as markers for the identification of Escherichia coli. The most frequently found peak values for the strains in the mass spectra corresponded to approximately 5753 (100%), 6256 (100%), 8326 (83.3%), 7275 (83.3%), 10463 (66.6%) and 4365 m/z (50%). However, the measurement of the Euclidean distance generated by Minitab software in the MALDI TOF analysis revealed the level of genetic proximity among the Escherichia coli strains that were classified into 02 different groups (I and II) with a value greater than 5.5 Euclidean distance and 06 different genotypes (Table 1, Fig. 3). Escherichia coli DH5α, Escherichia coli JM109 and Escherichia coli ATCC 8739 strains were classified in Group I. The Euclidean distance obtained between groups IA and IB was close to 4.5. Escherichia coli DH5α (genotype IA1) and Escherichia coli JM109 (genotype IA2) strains presented lower genetic distance when compared to all other analyzed strains, obtaining a Euclidean distance lower than 1.5 (Fig. 3). Although belonging to Group I, Escherichia coli ATCC 8739 (genotype IB) strain showed a significant genetic distance from the K-12 strains of such group (genotypes, IA1 and IA2). Escherichia coli BL21DE3 strains (derived from B cell) and Escherichia coli MC1061 with IIA1 and IIA2 genotypes, respectively, demonstrated a Euclidean distance lower than 2.0. Data from the literature demonstrate that MC1061 strain, despite being a K-12, has characteristics of Escherichia coli derived from B cells in its genome [8]. Although the Escherichia coli strain W3110 was considered as belonging to group B, it was distanced from those related to group A of which Euclidean distance corresponded to 4.0. Considering only the Escherichia coli W3110 and Escherichia coli ATCC 8739 strains as K-12 and non-K-12 lineages, respectively, it was possible to verify the great genetic distance between them (greater than 5.5) (Fig. 3). Since the obtained results were promising for differentiation between Escherichia coli W3110 from another non-K-12 we explored the generated data with MALDI TOF analysis searching for masses suitable for proteins that are candidate markers for Escherichia coli W3110 lineage. It was observed in Table 2, which demonstrates the specific peaks of Escherichia coli W3110 that are absent in Escherichia coli ATCC 8739 (3265, 3636, 4183, 5611, 8778, 8993, 9535 and 10298) strain. Ilina et al. (2009) described the most reproducible peaks corresponding to masses of Escherichia coli DH5α ribosomal proteins obtained by MALDI TOF mass spectrometry [14]. In Table 3, we can observe the comparison among the peaks corresponding to the masses of total proteins obtained in the 06 strains studied in this work with the masses of ribosomal proteins of Escherichia coli DH5α lineage described by Ilina et al. (2009) [14]. When comparing Escherichia coli W3110 and Escherichia coli ATCC 8739 lineages, it is possible to verify the presence of strains corresponding to ribosomal protein markers absent in the non-K-12 strain (RL 27, RS20 and RS19) (Table 3). However, sequencing of such proteins, as well as the molecular mass analysis by Sodium Dodecyl Sulfate-Polyacrylamide gel electrophoresis (SDS-PAGE), would provide significant information to consider them as markers for Escherichia coli W3110 strains as described in the literature [6,13]. When comparing the mass profile of the proteins of Escherichia coli strain DH5α obtained with those generated for Escherichia coli DH5α according to Ilina et al. (2009) low similarity was observed (Table 3) [14]. However, the authors used fractionation of protein extracts and analyzed only the ribosomal proteins separated from the remaining total proteins. Differently, the protein extracts of Escherichia coli strains used in the MALDI TOF analysis of the developed study were composed of total proteins. Muroi et al. (2012) explored the possibility of the differentiation between wild Escherichia coli strains from those resistant to ampicillin by MALDI TOF mass spectrometry [23]. Only in the ampicillin-resistant strains, a peak of 29,000 m/z was detected of which SDS-PAGE analysis and peptide sequencing revealed to be the β-lactamase enzyme. The work suggests possibilities of using a proteomic approach by MALDI TOF to identify Escherichia coli strains carrying plasmids of which selection is based on resistance to the ampicillin encoded by the β-lactamase gene.
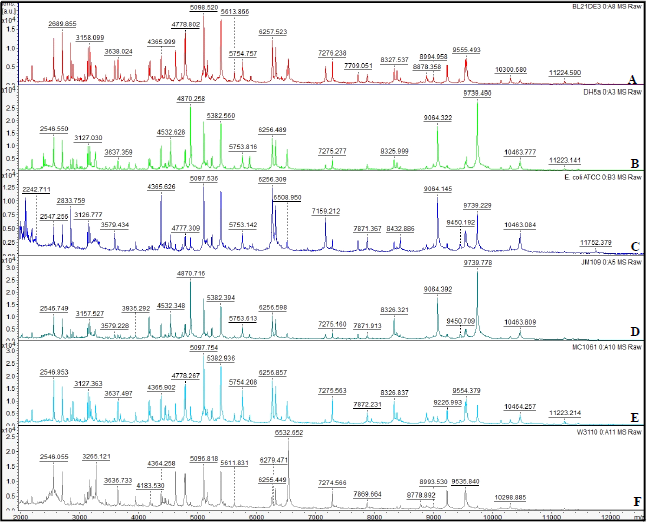 | Figure 2: Mass spectra obtained by MALDI-TOF analysis with total cellular protein extracts from different Escherichia coli lineages. The mass spectra were obtained within the range of 2000 to 20,000 m/z. The relative intensity of the ions is indicated on the Y axis and the profile of the obtained masses on the X axis. Panels A to F: Mass spectra generated from Escherichia coli BL21DE3+, Escherichia coli DH5α, Escherichia coli ATCC 8739, Escherichia coli JM109, Escherichia coli MC1061 and Escherichia coli W3110 strains, respectively. [Click here to view] |
 | Table 3: Analysis of the presence or absence of the most reproducible peaks corresponding to masses of Escherichia coli K-12 DH5α ribosomal proteins described in the literature compared to the Escherichia coli strain peaks of this study. [Click here to view] |
 | Figure 3: Dendrogram of the genetic relationship of different Escherichia coli strains generated through MADI TOF analysis. The Y axis shows the Euclidean distance and the in the X axis the following Escherichia coli strains are demonstrated: 1- Escherichia coli W3110, 2- Escherichia coli DH5α, 3- Escherichia coli JM109, 4- Escherichia coli MC1061, 5- Escherichia coli BL21DE3 and 6- Escherichia coli ATCC 8739. [Click here to view] |
4. CONCLUSION
The genomic and proteomic methods ERIC-PCR and MALDI-TOF, respectively, were used as tools to discriminate lineages of Escherichia coli strains. The results revealed the potential of the MALDI TOF method to differentiate interspecies as well as the possibility of distinguishing K-12 lineages. However, the ERIC-PCR method was able only to discriminate against E. coli ATCC from E. coli K-12 lineages here tested. Experiments based on peptide sequencing and SDS-PAGE could be performed as future prospects aiming to confirm masses generated in the spectra obtained for Escherichia coli strains in MALDI TOF analysis. Protein identification and characterization may confirm potential biomarkers for Escherichia coli K-12 strains to be validated as standards in mass spectrometer databases.
5. ACKNOWLEDGMENTS
We are grateful to biotechnological industry Novo Nordisk ProduÇão Farmacêutica do Brasil for the financial support and the Biotechnology graduate program of the State University of Montes Claros.
6. CONFLICTS OF INTEREST
The authors declare that there is no conflict of interest.
7. REFERENCES
1. Antunes GA, Gandra JACD, Moreira EA, Machado WCS, Magalhães SSG, Xavier MAS, Xavier AREO. AvaliaÇão do Ágar Coliforme Chromocult e ensaio duplex PCR como metodologias para rastreamento de Escherichia coli K12 em processo biotecnológico industrial. J Appl Pharm Sci 2018; 8:126-132.
2. Ardakani MA, Ranjbar R. Molecular typing of uropathogenic E. coli strains by the ERIC-PCR method. Electron Physician 2016; 8:2291-2296.CrossRef
3. Azpiroz MF, Laviña M. Analysis of RecA-independent recombination events between short direct repeats related to a genomic island and to a plasmid in Escherichia coli K12. Peer J, 2017; 5:e3293.CrossRef
4. Bauer AP, Dieckmann SM, Ludwig W, Schleifer KH. Rapid identification of Escherichia coli safety and laboratory strain lineages based on Multiplex-PCR. FEMS Microbiol Lett 2007; 269:36-40.CrossRef
5. Blattner FR, Plunkett G, Bloch CA, Perna NT, Burland V, Riley M, Vides JC, Glasner JD, Rode CK, Mayhew GF, Gregor J, Davis NW, Kirkpatrick HA, Goeden MA, Rose DJ, Mau B, Shao Y. The Complete Genome Sequence of Escherichia coli K-12. Science 1997; 277:1453-1462.CrossRef
6. Camara JE, Hays FA. Discrimination between wild-type and ampicillin-resistant Escherichia coli by matrix-assisted laser desorption/ionization time-of-flight mass spectrometry. Anal Bioanal Chem 2007; 389:1633-1638.CrossRef
7. Carattoli A. Resistance Plasmid Families in Enterobacteriacea. Antimicrob Agents Chemother 2009; 53:2227-2238.CrossRef
8. Casadaban MJ, Cohen SN. Analysis of Gene Control Signals by DNA Fusion and Cloning in Escherichia coli. J Mol Biol 1980; 138:179-207.CrossRef
9. Costa TE, Dias AP, Scheidegger EM, Marin VA. AvaliaÇão de risco dos organismos geneticamente modificados. Cien Saude Colet 2011; 16:327-336.CrossRef
10. Dallagassa CB, Huergo LF, Stets MI, Pedrosa FO, Souza EM, Cruz LM, Assis FEA, Wolf S, Volanski W, Picheth G, Denardi CPP, Farah SMSS, Fadel-Picheth CMTF. Matrix-assisted laser desorption ionization time of flight mass spectrometry analysis of Escherichia coli categories. Genet Mol Res 2014; 13:716-722.CrossRef
11. Duan H, Chai T, Liu J, Zhang X, Qi C, Gao J, Wang Y, Cai Y, Miao Z, Yao M, Schlenker MY. Source identification of airborne Escherichia coli of swine house surroundings using ERIC-PCR and REP-PCR. Environ Res 2009; 109:511-517.CrossRef
12. Gandra JACD, Machado WCS, Oliveira AME, Nogueira HS, Magalhães SSG, Sanches G, Xavier MAS, Xavier AREO. Análise comparativa entre os métodos microbiológicos membrana filtrante e espalhamento na recuperaÇão de Escherichia coli K12 em soluÇão salina propositalmente contaminada. Revista Unimontes CientÍfica 2017; 19:13-24.
13. Hu YY, Cai JM, Zhou HW, Zhang R, Chen GX. Rapid detection of porins by matrix-assisted laser desorption/ionization-time of flight mass spectrometry. Front Microbiol 2015; 6:784.CrossRef
14. Ilina EN, Borovskaya AD, Malakhova MM, Vereshchagin VA, Kubanova AA, Kruglov AN, Svistunova TS, Gazarian AO, Maier T, Kostrzewa M, Govorun VM. Direct Bacterial Profiling by Matrix-Assisted Laser Desorption-Ionization Time-of-Flight Mass Spectrometry for Identification of Pathogenic Neisseria. J Mol Diagn 2009; 11:75-86.CrossRef
15. Kato TO, Yamamoto N, Suzuki M, Fukunaga T, Tamura H. Discrimination of Escherichia coli O157, O26 and O111 from Other Serovars by MALDI-TOF MS Based on the S10-GERMS Method. PLoS ONE 2014; 9:e113458.CrossRef
16. Kuhnert P, Nocolet J, Frey J. Rapid and Accurate Identification of Escherichia coli K-12 Strains. Appl Environ Microbiol 1995; 61:4135-4139.
17. Lafolie J, Sauget M, Cabrolier N, Hocquet D, Bertrand X. Detection of Escherichia coli sequence type 131 by matrix-assisted laser desorption ionization time-of-flight mass spectrometry: implications for infection control policies? J Hosp Infect 2015; 90:208-212.CrossRef
18. Liu H, Du Z, Wang J, Yang R. Universal sample preparation method for characterization of bacteria by matrixassisted laser desorption ionization-time of flight mass spectrometry. Appl Environ Microbiol 2007; 73:1899-1907.CrossRef
19. Lynn EC, Chung MC, Tsai WC, Han CC. Identification of Enterobacteriaceae bacteria by direct matrixassisted laser desorptiom/ionization mass spectrometric analysis of whole cells. Rapid Commun Mass Spectrom 1999; 13:2022-2027.CrossRef
20. Mazzeo MF, Sorrentino A, Gaita M, Cacace G, Stasio MD, Facchiano A, Comi G, Malorni A, Siciliano RA. Matrix-assisted laser desorption ionization-time of flight mass spectrometry for the discrimination of food-borne microorganisms. Appl Environ Microbiol 2006; 72:1180-1189.CrossRef
21. Meacham KJ, Zhand L, Foxman B, Bauer RJ, Marrs CF. Evaluation of genotyping large numbers of Escherichia coli isolates by enterobacterial repetitive intergenic consensus-PCR. J Clin Microbiol 2003; 41:5224-5226.CrossRef
22. Miralles NF, EspÍn JD, Corchero JL, Vázquez E, Villaverde A. Microbial factories for recombinant pharmaceuticals. Microb Cell Fact 2009; 8:1-8.
23. Muroi M, Shima K, Igarashi M, Nakagawa Y, Tanamoto K. Application of Matrix-Assisted Laser Desorption Ionization-Time of Flight Mass Spectrometry for Discrimination of Laboratory-Derived Antibiotic-Resistant Bacteria. Biol Pharm Bull 2012; 35:1841-1845.CrossRef
24. Porte L, GarcÍa P, Braun S, Ulloa MT, Lafourcade M, Montaña A, Miranda C, Acosta-Jamett G, Weitzel T. Head-to-head comparison of Microflex LT and Vitek MS systems for routine identification of microorganisms by MALDI- TOF mass spectrometry in Chile. PLoS ONE 2017; 12:e0177929.CrossRef
25. Santos T, Capelo JL, Santos HM, Oliveira I, Marinho C, GonÇalves A, Araújo JE, Poeta P, Igrejas G. Use of MALDI-TOF mass spectrometry fingerprinting to characterize Enterococcus spp. and Escherichia coli isolates. J Prot 2015; 127:321-31.CrossRef
26. Sauget M, Chanoine MHN, Cabrolier N, Bertrand X, Hocquet D. Matrix-assisted laser desorption ionization-time of flight mass spectrometry assigns Escherichia coli to the phylogroups A, B1, B2 and D. Int J Med Microbiol 2014; 304:977-983.CrossRef
27. Siegrist TJ, Anderson PD, Huen WH, Kleinheinz GT, McDermott CM, Sandrin TR. Discrimination and characterization of environmental strains of Escherichia coli by matrix-assisted laser desorption/ionization time-of-flight mass spectrometry (MALDI-TOF-MS). J Microbiol Methods 2006; 68:554-562.CrossRef
28. Simões GAR, Xavier MAS, Oliveira DA, Menezes EV, Magalhães SSG, Gandra JACD, Xavier AREO. Genetic markers for detection of Escherichia coli K-12 harboring ampicillin-resistance plasmid from an industrial wastewater treatment effluent pond. Genet Mol Res 2016; 15:1-12.CrossRef
29. US Environmental Protection Agency – US EPA, Biotechnology Program Under Toxic Substances Control Act (TSCA). 1997. Escherichia coli Derivatives Final Risk Assessment. Available at http://www.epa.gov/biotech_rule/pubs/fra/fra004.htm. Accessed March 14, 2018.CrossRef
30. Versalovic J, Koeuth T, Lupski JR. Distribution of repetitive DNA sequences in eubacteria and application to fingerprinting of bacterial genomes. Nucleic Acids Res 1991; 19:6823-6831.CrossRef
31. Wilson LA, Sharp PM. Enterobacterial Repetitive Intergenic Consensus (ERIC) Sequences in Escherichia coli: Evolution and Implications for ERIC-PCR. Mol Biol Evol 2006; 23:1156-1168.CrossRef
32. Zhu J, Hill JE. Detection of Escherichia coli via VOC Profiling using Secondary Electrospray Ionization-Mass Spectrometry (SESI-MS). Food Microbiol 2013; 34:412-417.CrossRef