
1. INTRODUCTION
The escalating global plastic crisis presents critical environmental, economic, and public health challenges, with plastic production increasing by approximately 9% annually – from 2 Mt in 1950 to 400 Mt in 2022 [1,2]. Cumulatively, over 5800 Mt of plastic waste has been mismanaged, and by 2035, oceanic plastic mass could rival that of all fish in the ocean [3]. Bioplastics, particularly polyhydroxyalkanoates (PHAs), offer a sustainable alternative due to their biodegradability, renewability, and properties that mimic conventional plastics [4].
PHAs are intracellular polyesters synthesized by diverse microorganisms under nutrient-limiting conditions, serving as carbon and energy reserves [5]. Poly-3-hydroxybutanoate (PHB) is the most abundant and well-characterized PHA. The physicochemical properties of PHAs can be modulated through microbial strain selection, carbon source, fermentation conditions, and systems engineering [6-8]. Once extracted from the microbe, PHAs can be used in diverse applications such as packaging materials, biomaterials (e.g., implants), and in pharmaceutical industries [5].
Despite their promise, PHAs face economic limitations, with production costs largely determined by carbon feedstock and downstream processing [8]. Leveraging inexpensive, renewable substrates such as lignin could overcome these barriers. As a complex aromatic polymer representing ~30% of plant biomass carbon, lignin remains underutilized due to its recalcitrance and the toxicity of its lignin breakdown products (LBPs) to many microbes [9].
Rhodopseudomonas palustris CGA009, a purple non-sulfur bacterium, exhibits extraordinary metabolic versatility. It can fix atmospheric CO2 and N2 and catabolize a wide range of organics, including lignocellulosic wastes [10-13]. Genomic analyses reveal that R. palustris encodes three of the four known LBP degradation pathways under both aerobic and anaerobic conditions [14,15], and it has been shown to produce PHAs using lignin-derived carbon sources [11,13,16]. Moreover, it is recognized for generating additional high value bioproducts such as biohydrogen [12,13,17], making it an attractive microbial chassis for lignocellulosic biorefineries.
However, the regulatory network underpinning PHA metabolism in R. palustris remains poorly understood. PHA biosynthesis involves granular-associated proteins (GAPs), including synthases, depolymerases, PHA repressor proteins, acyl-CoA synthase, and phasins [Figure 1]. Phasins, in particular, are small amphiphilic proteins that coat PHA granules and play key roles in granule formation, stabilization, and metabolic regulation [18-20]. Once thought to serve only structural functions, phasins are now recognized for chaperone-like activities and for mitigating stress in both PHA-producing and non-producing cells [21].
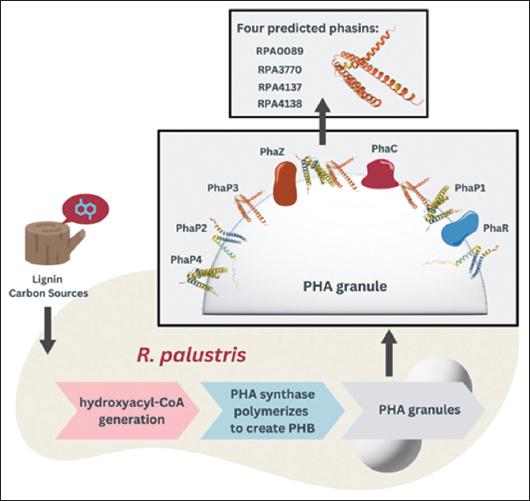 | Figure 1: Proposed proteins on the surface of polyhydroxyalkanoates granules in Rhodopseudomonas palustris. [Click here to view] |
Recent studies show phasins influence PHA granule composition [16] and support cellular fitness under industrial conditions [20,21]. For example, heterologous expression of a phasin in Escherichia coli enhanced tolerance to industrial solvents and improved biofuel yields [21]. Phasins also exhibit functional diversification within species; Cupriavidus necator H16 encodes up to eight distinct phasins with differing roles [22,23]. Systems biology approaches have leveraged this knowledge of phasin functionality to promote PHA production even under non-stress growth conditions [23]. Phasins have also proven valuable in other biotechnological applications, including affinity purification [24], bioremediation [25], drug delivery [24], and sustainable agricultural production [26,27].
Despite R. palustris’ ability to produce PHAs, its phasins have not been experimentally studied. Genomic analysis suggests four candidate genes – RPA0089, RPA4137, RPA4138, and RPA3770 – encode phasin-like proteins based on conserved hydrophobic motifs common to known phasins [16,28]. Yet, the expression and function of these bioinformatically-predicted phasins in R. palustris’ genome remain unexplored.
To this end, this study addresses these knowledge gaps by using transcriptomic and targeted proteomic analyses to investigate the identity, regulation, and expression of these putative phasins under varying carbon conditions, including the lignin-derived substrate p-Coumarate (pC). This multi-omics strategy enables a first-of-its-kind characterization of phasins in R. palustris and their role in lignin valorization through bioplastic synthesis.
2. MATERIALS AND METHODS
2.1. Growth Conditions
R. palustris (Molisch) van Niel BAA-98, strain designation CGA009 (R. palustris), was obtained from American Type Culture Collection (ATCC, Virginia, USA) and cells were stored at −80°C in 20% glycerol until ready for further processing. Cells were taken from −80°C and streaked onto agar plates. For seed culture preparation, cells were inoculated into 50 mL of media in 250 mL flasks. Seed culture media was photosynthetic mineral medium containing 10 mM sodium bicarbonate, 15.2 mM ammonium sulfate, 0.1457 mM thiosulfate, and 50 mM of both monopotassium phosphate and sodium phosphate dibasic [11,13,16]. Sodium acetate (20 mM) was also added for seed cultures. Cultures were grown aerobically in the dark at 30°C with continuous shaking at 275 rpm. Cell growth was monitored by measuring optical density at 660 nm with a Genesys 10S ultraviolet-Vis spectrophotometer (Thermo Fisher Scientific, Massachusetts, USA).
2.2. RNA Extraction
An improved RNA extraction protocol for R. palustris was developed during this study to achieve increased RNA yields, quality, and reduced processing time compared to previous methods [29]. Since R. palustris is difficult to lyse, the optimized method uses the Qiagen RNA Plus extraction kit (QIAGEN, Hilden, Germany), combining enzymatic lysis, proteinase K digestion, and mechanical disruption. Extreme caution was used to treat all equipment and working spaces with RNase-AWAY solution (Thermo Fisher Scientific, Massachusetts, USA) and to use only RNase-free equipment. The entire procedure was performed without interruption, and samples were kept either on ice unless otherwise indicated by manufacturer’s instructions. The lysate samples were immediately subjected to The QIAGEN RNase-Free DNase Set for on-column DNase digestion (QIAGEN, Hilden, Germany). Of note, two columns were used for each RNA sample to ensure removal of DNA. Total RNA samples were immediately stored in aliquots in −80°C until further use. All RNA samples were assessed for degradation through bleach gels, and only samples with strong double bands were used for cDNA conversion [16]. RNA samples that were not degraded according to the bleach gel analysis were converted to cDNA in 20 μL reactions using the High-Capacity cDNA Reverse Transcription Kit (Applied Biosystems, Massachusetts, USA). All cDNA was tested with the 16SrRNA housekeeping primer to ensure quality cDNA was being used for further quantitative polymerase chain reaction (qPCR) assessment [Table 1].
Table 1: Custom oligonucleotides used for RT-qPCR analysis of R. palustris samples. Primer concentrations were optimized before proceeding with RT-qPCR fold change analysis.
| Function | Gene | Forward | Reverse |
|---|---|---|---|
| Phasin | RPA4137 | ATCCGTTTT CCACCG TGCTG | CGTCCTTCAGCTTGGCGTAG |
| Phasin | RPA4138 | GCAAGGCGT TCGAGCACATG | ACGAGCTGCTGGGCGTAATC |
| Phasin | RPA3370 | CCAGATCCAGTTCGACCTTGC | TGAAGTTGTCCTGCACCGAC |
| Phasin | RPA0089 | TCTTGC ACGCCAAGGACTTTC | GGAACGATAACGGTCGGTTG |
| Housekeeping | 16SrRNA | GTTCGGAACAACACAGGGAAA | GATCATCCTCTCAGACCAGCTAC |
| PHB depolymerase | RPA0565 | GATCATCCTCTCAGACCAGCTAC | CCTTTGGGGACGAACGAGAAC |
RT-qPCR: Real-time-quantitative polymerase chain reaction, R. palustris: Rhodopseudomonas palustris, PHB: Poly-3-hydroxybutanoate.
2.3. Real-time RT-qPCR
Oligonucleotides used for RT-qPCR are shown in Table 1. Primer concentrations for RT-qPCR reactions were initially evaluated by performing 25 μL polymerase chain reaction reactions using Go Taq® Master Mix (Promega, Wisconsin, USA) with approximately 100 μg of gDNA, for primer concentrations ranging from 350 to 50 nM. A second set of reactions containing no gDNA was also prepared. Thermo cycler settings for this reaction were 95°C for 2 min, 40 cycles of (95°C for 45 s, 60°C for 45 s, and 72°C for calculated seconds based on amplicon length), and then 72°C for 5 min. Gel electrophoresis using ×1 TAE 2% agarose gels was implemented to ensure the oligomers produce bands of the correct sizes and did not produce false positives in non-template reactions without DNA. Once the ideal primer concentration was confirmed, this concentration was utilized for the RT-qPCR primer efficiency tests.
The primer efficiency of each oligomer pair was determined by preparing qPCR reactions with PowerUp SYBR® Green Master Mix (Life Technologies, California, USA). Primers were tested using a ×5 dilution series of cDNA (500 ng/μL–0.0061 ng/μL) with thermocycler settings of: 50°C for 2 min, 95°C for 2 min, 40 cycles of (95°C for 15 s, 60°C for 1 min), and a melting curve step (60°C for 1 min, rising at a rate of 1.5°C for 20 min, and staying at 95°C for 15 s) to ensure a single amplicon. Triplicates without added cDNA (i.e., non-template controls) were included with each dilution reaction to safeguard against false positives. The automatic baseline calculator was used, and cycle threshold (Ct) values were obtained accordingly. The Log10 of the number of cDNA copies versus the Ct value was plotted for each primer set. The slope of the linear regression of this plot depicts primer efficiency, and only primer sets with efficiencies between 90 and 110% were used for further analysis.
All RT-qPCR reactions were performed with biological triplicates and at least five technical replicates using the same settings as for primer efficiency determination. The PowerUp SYBR® Green Master Mix (Life Technologies, California, USA) was used for all reactions, taking care to use non-contaminated aliquots for each analysis. The delta-delta Ct method, also known as the 2−ΔΔCt method, was used to calculate the relative fold change for gene expression of each gene under the associated condition [30]. Data from the aerobic pC condition were used as the baseline to compare expression data since R. palustris does not produce PHB in aerobic conditions.
2.4. Proteomics
2.4.1. Protein extraction
Anaerobic samples from mid-exponential phase on pC (pC Mid) or acetate (A Mid), and after 5 days of nitrogen starvation (pC N- and A N-) were collected for proteomics. Aerobic samples grown on acetate (A O+) were also saved to use as a control since R. palustris does not produce bioplastic under aerobic conditions. To prepare for protein extraction, bacterial cells were pelleted by centrifugation at 4°C for 30 min at 3000 g through an Eppendorf 5810R Refrigerated Centrifuge (Eppendorf, Hamburg, Germany). Cell pellets were washed with cold ×1 phosphate buffered saline, centrifuged again, washed again, decanted, and stored immediately at −80°C until further processing.
Proteins were extracted using the Pierce™ B-PER Complete Extraction Solution for bacteria (Thermo Fisher Scientific, Massachusetts, USA). One Pierce™ Protease Inhibitor Tablet, ethylenediaminetetraacetic acid-free (Thermo Fisher Scientific, Massachusetts, USA) was dissolved in each 50 mL extraction solution before use to inhibit protein degradation. Samples were centrifuged at 4°C for 30 min at 3000 g and kept on ice unless otherwise specified by the manufacturer’s instructions.
Bacterial cell lysates (3.0–3.5 mL) were then subjected to the sequential filtrations on series of Amicon Ultra-0.5 Centrifugal Filter Devices (Millipore, Massachusetts, USA) to: (i) Reduce protein sample complexity, (ii) exchange the buffer, and (iii) concentrate the protein. For each ultra-centrifugal device (filter), relative centrifugation force was used as recommended by the manufacturer, and the time of centrifugation was adjusted as needed. Hence, for downstream proteomics, two protein molecular weight (MW) fractions of each bacterial lysate were obtained: 3–30 kDa and 30–100 kDa.
First, lysates were centrifuged on the 30 kDa filters to separate small MW proteins, where phasins presence was expected. The eluates (flow-through) containing small proteins were further spun on 3 kDa filters to rid samples of proteins and peptides smaller than 3 kDa. During this step, original lysis buffer was exchanged for 100 mM ammonium bicarbonate/5% acetonitrile (ACN) (3 times with 400 μL) and protein samples were concentrated, which resulted in obtaining 3–30 kDa MW fractions. Second, the eluents/retentates (top portion from 30 kDa filtration) were subjected to the buffer exchange with 100 mM ammonium bicarbonate/5% ACN (3 times with 400 μL) on the same 30 kDa filters. Buffer exchanged protein samples were then centrifuged on 100 kDa filters to remove proteins larger than 100 kDa and to obtain final 30–100 kDa MW fractions. Protein concentrations in all final protein sample fractions were determined using the 2D-Quant Kit (Cytiva, Massachusetts, USA).
2.4.2. In-solution digestion
Before mass spectrometry (MS), all protein sample fractions were subjected to in-solution digestion as follows. To the volume corresponding to 20 μg protein, 1/10 volume of 100 mM dithiothreitol was added and samples were incubated at 65°C for 15 min (reduction). Alkylation was carried out by adding 1/10 volume of 100 mM iodoacetamide and incubating at room temperature for 45 min in the dark. To aid trypsin digestion, samples were complemented with ACN to 5% final concentration. MS grade Trypsin (Promega, Wisconsin, USA) was used to 25:1 μg of protein, and the trypsin ratio and mixture was left digesting overnight at 37°C. The following morning, the tryptic digests/peptides were acidified with 1% formic acid to 0.1% final concentration. They were then lyophilized in a Labconco freeze dryer (Labconco, Missouri, USA) and stored at −80°C. Immediately before MS, lyophilized peptides were resuspended in 2% ACN/0.1% formic acid to a final concentration of 0.5 μg/μL, centrifuged at 20,000 x g for 15 min, and transferred to MS vials.
2.4.3. Protein identification through liquid chromatography-tandem MS (LC-MSMS)
LC-MSMS was performed using the Ultimate 3000 UHPLC system linked to LTQ Orbitrap Velos hybrid mass spectrometer (both Thermo Fisher Scientific, Massachusetts, USA) as published previously with modifications [31]. Briefly, 2 μg of protein tryptic digest were separated on reversed phase Acclaim PepMap C18 column (Thermo Fisher Scientific, Massachusetts, USA) under constant flow of 0.3 μL min−1, through 60 min long linear gradient of ACN and 0.1% (v/v) formic acid as follows: 2% ACN for 5 min, 2–55% ACN for 30 min, 95% ACN for 10 min, and 2% ACN for 15 min. The mass spectra were collected in the data dependent acquisition mode utilizing the orbitrap detector to measure accurate monoisotopic masses of precursor ions (MS), while the products of collision induced decay were detected in linear trap (MSMS). In total, the method included 14 repeating scan events: One MS scan followed by 13 MS/MS scans for the 13 most intense ions detected in MS scan (with dynamic exclusion being applied). The method and raw spectral files were created and generated, respectively, by Xcalibur 2.1 (Thermo Fisher Scientific, Massachusetts, USA) foundational software.
Protein identification and relative intra-sample quantitation of phasins was performed utilizing the Proteome Discoverer (Thermo Fisher Scientific, Massachusetts, USA) software, versions 2.5 and 2.1, respectively. Experimental spectral data were matched against the R. palustris protein referenced database downloaded from the National Center for Biotechnology Information database as of June 2024. Both target and decoy (reversed) databases were searched for more stringent approach to estimate false discovery rates (FDR). The search results were filtered by FDR <1.00%. The relative quantitation was based on calculated exponentially modified protein abundance indexes (emPAI) for identified phasins in pertinent samples [32].
2.5. Statistical Methods
All experiments were conducted with at least three biological replicates. All statistical analyses (Student’s two-tailed t-test with unequal variances) were performed using Microsoft Excel, and P < 0.05 was applied to filter statistically significant results. All error bars represent the population standard deviation and were calculated using Excel.
3. RESULTS AND DISCUSSION
To garner a more holistic understanding of how phasin expression differs between growth conditions and carbon sources, we conducted RT-qPCR analysis for R. palustris cells grown on pC versus acetate and up to 5 days of nitrogen starvation. Figure 2 depicts the fold changes in gene expression for the four predicted phasins and for PHB depolymerase. PHB depolymerase is an enzyme that splits PHB into a dimer and a monomer and is essentially involved in breaking down PHB so that the cell can use the products for other functions. There was no significant fold change for PHB depolymerase under anaerobic mid-exponential growth on acetate compared to the fold change for the predicted phasins. Two genes predicted to code for phasins, RPA0089 and RPA3770, had a significantly higher fold change for gene expression when R. palustris is producing bioplastics. Under pC Mid, R. palustris produces a slight amount of PHB [11,13,16], and during this phase the only Phasin gene that had a significantly higher fold change than the others was RPA3770. This suggests that perhaps RPA3770 plays a role in PHB initiation and perhaps may interact with PHA synthase. Once nitrogen starvation is initiated, R. palustris begins to produce bioplastics as a redox and carbon storage mechanism.
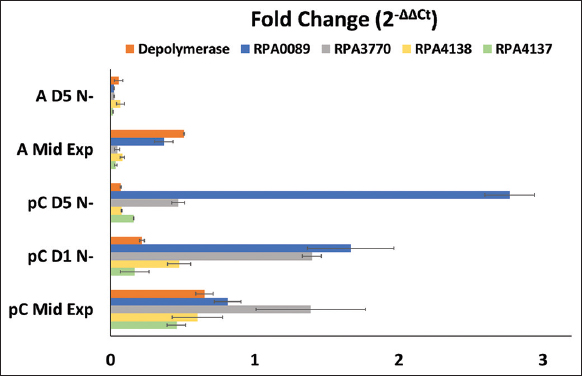 | Figure 2: Fold change of the four predicted phasins (RPA0089, RPA3770, RPA4137, and RPA4138) and PHB depolymerase from Rhodopseudomonas palustris cells grown on p-Coumarate and acetate (a) at mid-exponential (Mid Exp), 1 day past nitrogen starvation (D1 N-), and 5 days past nitrogen starvation (D5 N-). All experiments were conducted with at least three biological replicates and five technical replicates. P < 0.05 was applied to filter statistically significant results. Error bars are the calculated standard deviations based on the population. [Click here to view] |
Under nitrogen starved conditions when PHB accumulation is significantly stimulated, there is an inverse relationship between PHB depolymerase fold change when grown on acetate versus pC. This is logical because R. palustris does not produce bioplastic on acetate since it does not have enough carbon or reducing power compared to pC, as identified in our previous metabolic modeling study [13]. Thus, PHB depolymerase transcription is higher when R. palustris is nitrogen starved and using acetate as a carbon source because it cannot afford to accumulate PHB. The only Phasin gene that had a significantly higher fold change than the others when using acetate as a carbon source was RPA0089. Only one phasin gene had a significantly higher fold change than the other phasins at mid-exponential growth stage, which was RPA3770. Once nitrogen starvation is initiated, the fold change for RPA3770 drops below that of RPA0080 as time elapses up to 5 days of nitrogen starvation, and RPA0089 has the highest expression at 5 days past nitrogen starvation. Yet, the expression of RPA3770 remains significantly higher than RPA4138 and RPA4137 throughout the entire period. Both RPA0089 and RPA3770 gene expressions are significantly higher than other phasins at maximum PHB production.
Overall, transcriptomics analysis revealed that:
The fold change for all predicted phasins is significantly higher on pC than acetate, likely given that R. palustris does not produce PHB on acetate
RPA3370 was the only phasin to have a significantly higher fold change under mid-exponential growth on pC, suggesting it may have a role in preventing PHB accumulation or perhaps a role in initiating PHB production
RPA0089 expression increases as nitrogen starvation progresses and has the highest fold change of all predicted phasin genes by day 5 of PHB production
It is likely that RPA0089 and RPA3770 code for the dominant phasins employed by R. palustris
After the gene expression analysis revealed a clear discrepancy between the expressions of phasin genes during PHB production, targeted proteomics analysis was conducted to identify if the phasin proteins were indeed being produced on acetate or pC as well as under aerobic and anaerobic conditions. This study was able to confirm that all four of the predicted Phasin genes do indeed produce a phasin protein [Table 2]. During anaerobic growth on pC before nitrogen starvation was initiated, the only phasin protein that was not detected (ND) was RPA0089. However, after nitrogen starvation, RPA0089 was found. No phasin proteins were detected when using acetate as a carbon source, which is likely due to R. palustris not producing bioplastics on this carbon source. Finally, no phasin proteins were detected under aerobic conditions, which is likely due to R. palustris not producing PHB under this condition (it was used as a negative control essentially). The fact that no phasins proteins were detected under conditions when R. palustris does not produce PHB indicates that phasin proteins are not constitutively expressed, but rather strategically employed for PHB metabolism. The relative phasin abundance within the pC Mid and pC N- samples indicates the RPA3770 and the RPA0089 as the most and least prevalent, respectively. These findings do not correspond with transcriptomics data [Figure 2] entirely. The discrepancy could originate in limitation of the emPAI method (Materials and Methods), but also, it can be a demonstration of a well observed phenomenon that gene transcription does not equal to protein expression.
Table 2: Proteomics results.
| Protein | pC Mid | pC N- | A Mid | A N- | A O+ |
|---|---|---|---|---|---|
| RPA3770 | 1.00 | 1.00 | ND | ND | ND |
| RPA4137 | 0.75 | 0.41 | ND | ND | ND |
| RPA4138 | 0.17 | 0.21 | ND | ND | ND |
| RPA0089 | ND | 0.14 | ND | ND | ND |
The relative quantitation for the four identified phasins is listed and is based on calculated exponentially modified protein abundance indexes (emPAI). Rhodopseudomonas palustris protein samples processed from anaerobic conditions at mid-exponential growth on p-Coumarate (pC Mid) or acetate (A Mid), or after 5 days of nitrogen starvation (pC N- or A N-) are compared to assess phasin activity since R. palustris does not produce bioplastics on acetate. Protein samples from aerobic conditions using acetate as the carbon source (A O+) were also included as a negative control. Green cell values indicate the phasins relative abundance based emPAI, while red cells indicate that the protein of interest was not detected. Data are representative of biological duplicates for each condition and at least technical triplicates for Liquid Chromatography-Tandem Mass Spectrometry. ND: Not detected.
Ultimately, this is the first study to experimentally explore four phasin proteins employed by R. palustris for bioplastic metabolism. Given the transcriptomics and proteomics results from this study, it is likely that RPA0089 and RPA3770 code for the dominant phasins in R. palustris. Table 3 provides a summary of the GAPs employed by R. palustris compared to C. necator, a model bacterium for PHB production. There have been eight phasins discovered for C. necator thus far [33], and this summary highlights an intricate relationship between the phasins in C. necator with other GAPs. For example, PhaR is a transcriptional regulator of phasin expression in C. necator, but only for certain phasins (PhaP1 and PhaP3). A particular phasin, named PhaM in literature, is a multifunctional protein that acts as an activator of PHB synthase (PhaC) while also determining the number, surface to volume ratio, subcellular localization, and distribution to daughter cells of PHB granules.
Table 3: A summary of the granule associated proteins employed by R. palustris compared to C. necator, a model bacterium for bioplastic production.
| Protein | Function | C. necator H16 | R. palustris CGA009 |
|---|---|---|---|
| PhaC (PHB synthase) | The main enzyme responsible for the polymerization of PHB monomers into the polymer chain | phaC1 H16_A1437 phaC2 H16_A2003 PhaR (mentioned below) is the transcriptional regulator of the phaC1AB1 operon | RPA2501 |
| PhaZ (PHB depolymerase) | Breaks down PHB polymer when needed by the cell for energy mobilization | PhaZ1; H16_A1150 There are six putative PHB depolymerases | RPA0565 |
| PhaR | Transcriptional regulator of phasin expression; Regulates PHA synthesis through direct interaction with granules | E6A55_RS07275 Co-represses transcription of the PhaP1 gene (the main phasin) and that of PhaP3 [19] phaR regulates expression phaP1 but not phaP2; can bind to PHB granulesin vivo and to genomic DNA [19] | RPA0530 |
| Protein | Function | C. necator H16 | R. palustris CGA009 |
| Phasins | A family of small proteins that coat the surface of the PHB granule, aiding in its structural organization and preventing aggregation | 8 discovered | 4 discovered (this study) |
| PhaM | H16_A0141 A multifunctional protein that determines number, surface to volume ratio, subcellular localization and distribution to daughter cells of PHB granules; Acts as an activator of PhaC Responsible for anchoring PHB granules with the nucleoid | ? | |
| PhaP1 | H16_A1381The main phasin in C. necator H16. Expression of phaP1 is regulated by phaR [19] | RPA0089 (this study) | |
| PhaP2 | PHG202 phaP2 is not regulated by any regulators [19] | RPA3770 (this study) | |
| PhaP3 | H16_A2172 | RPA4137 (this study) | |
| PhaP4 | H16_B2021 | RPA4138 (this study) | |
| PhaP5 | H16_B1934 Strongly interacts with most other phasins and with PhaM [33] | ? | |
| PhaP6 | H16_B1988 | ? | |
| PhaP7 | H16_B2326 | ? | |
R. palustris: Rhodopseudomonas,C. necator: Cupriavidus necator, PHB: Poly-3-hydroxybutanoate.
Thus, it is likely that the four phasins employed by R. palustris that were identified in this study have particular roles and relationships with other GAPs. This study provides the foundation for further elucidation of PHA metabolism in R. palustris to:
Create phasin mutant strains with recently developed synthetic biology toolkits for R. palustris [29] to decipher whether the PHA titer, granule shape, and granule abundance are impacted
Identify which phasins, if any, function like PhaM from C. necator to activate PHA synthase and control granule configuration
Explore knocking out PHA metabolism to funnel more redox potential to biohydrogen production, as highlighted in our previous study regarding the tradeoffs of PHA and biohydrogen production [13]
Assess fluorescent fusions of the phasins to confirm their presence at select time points and localization in the cell [33]
Develop a genome-scale metabolic model for PHA metabolism in R. palustris to identify how phasins and other GAPs can be leveraged for industrial production [13]
Overexpress Phasin genes or create knockin strains to optimize PHA production under non-stress conditions, as previously demonstrated in R. palustris and C. necator [16,23].
4. CONCLUSION
This study experimentally explored gene transcription and protein expressions of four predicted phasins in R. palustris’ genome involved in bioplastic metabolism for the 1st time. An integrated –omics approach revealed that there are likely two primary phasins, RPA0089 and RPA3770, that are responsible for bioplastic production in R. palustris. All four phasins were experimentally detected and relatively quantified at the protein level. Transcriptomics and proteomics revealed that the four phasin proteins were expressed significantly differently as bioplastic production progressed and on different carbon sources. This study builds the foundation for future research that can further examine the role that these particular phasins play in PHA metabolism for R. palustris, such as creating knockout strains to pinpoint functionality. A metabolic comparison is also proposed from these research findings that compare R. palustris’ and C. necator, a model bacterium for bioplastic production, and current knowledge gaps regarding the PHA granule-associated-proteins employed to modulate bioplastic metabolism. Of note, future studies will now be able to illuminate which of the phasins explored in this study by R. palustris is responsible for activating PHA synthase to boost bioplastic production, a critical function that the phasin protein PhaM fulfills in C. necator. Findings from this study regarding phasin proteins that play a critical role in modulating PHA metabolism could be leveraged to downregulate PHA production and funnel more redox potential to biohydrogen production, a sustainable and clean energy alternative. Ultimately, phasins play a vital role in PHA metabolism, and this study progresses our knowledge of how R. palustris can be further employed as an industrial juggernaut of bioproducts manufacturing.
5. ACKNOWLEDGMENTS
We would like to thank Professors Mark Wilkins (Kansas State University) and Rajib Saha (University of Nebraska-Lincoln) for their mentorship and guidance in securing the grant funding, as well as Dr. Cheryl Immethun for her contributions. Further, we appreciate Dr. Cheryl Immethun and Dr. Dianne Morris for their inputs on experimental design given their expertise with this extraordinary microbe as well as for shipping culture plates. We extend special thanks to Professors Shien Lu, Richard Baird, and Richard Harkess and Mrs. Sonya Baird at Mississippi State University for their hospitality and use of resources.
6. AUTHORS’ CONTRIBUTIONS
All authors made substantial contributions to conception and design, acquisition of data, or analysis and interpretation of data; took part in drafting the article or revising it critically for important intellectual content; agreed to submit to the current journal; gave final approval of the version to be published; and agree to be accountable for all aspects of the work. All the authors are eligible to be an author as per the International Committee of Medical Journal Editors (ICMJE) requirements/guidelines.
7. FUNDING
We gratefully acknowledge funding support from the U.S. Department of Agriculture National Institute of Food and Agriculture (USDA-NIFA) Postdoctoral Fellowship grant (2022-67012-3827), and the Mississippi INBRE, funded by an Institutional Development Award (IDeA) from the National Institute of General Medical Sciences of the National Institutes of Health under grant number P20GM103476. The MS analysis was performed at the Institute for Genomics, Biocomputing and Biotechnology, with partial support from Mississippi Agricultural and Forestry Experiment Station, Mississippi State University.
8. CONFLICTS OF INTEREST
The authors report no financial or any other conflicts of interest in this work.
9. ETHICAL APPROVALS
This study does not involve experiments on animals or human subjects.
10. DATA AVAILABILITY
All the data is available with the authors and shall be provided upon request.
11. PUBLISHER’S NOTE
All claims expressed in this article are solely those of the authors and do not necessarily represent those of the publisher, the editors and the reviewers. This journal remains neutral with regard to jurisdictional claims in published institutional affiliation.
12. USE OF ARTIFICIAL INTELLIGENCE (AI)-ASSISTED TECHNOLOGY
The authors declare that they have not used artificial intelligence (AI)-tools for writing and editing of the manuscript, and no images were manipulated using AI.
REFERENCES
1. Houssini K, Li J, Tan Q. Complexities of the global plastics supply chain revealed in a trade-linked material flow analysis. Commun Earth Environ. 2025;6:257. [CrossRef]
2. Geyer R, Jambeck JR, Law KL. Production, use, and fate of all plastics ever made. Sci Adv. 2017;3:1700782. [CrossRef]
3. Pilapitiya PG, Ratnayake AS. The world of plastic waste:A review. Clean Mater. 2024;11:100220. [CrossRef]
4. Liang Z, Sethupathy S, Wenqian D, Jinhao H, Zhu D, Lignin valorization through microbial production of polyhydroxyalkanoates: Recent trends, challenges and opportunities. Green Chem. 2025;27(21):5920-46. [CrossRef]
5. Hadri SH, Tareen N, Hassan A, Naseer M, Ali K, Javed H. Alternatives to conventional plastics:Polyhydroxyalkanoates (PHA) from microbial sources and recent approaches - a review. Process Saf Environ Prot. 2025;195:106809. [CrossRef]
6. Kourmentza C, Placido J, Venetsaneas N, Burniol-Figols A, Varrone C, Gavala HN, et al. Recent advances and challenges towards sustainable polyhydroxyalkanoate (PHA) production. Bioengineering (Basel). 2017;4:55. [CrossRef]
7. Wang C, Liu RY, Xu T, Liu ZH, Li BZ, Yuan YJ. Valorizing lignin and coprecursors into homogeneous polyhydroxyalkanoates by engineered Pseudomonas putida. ACS Sustain Chem Eng. 2024;12:8402-14. [CrossRef]
8. Gundlapalli M, Ganesan S. Polyhydroxyalkanoates (PHAs):Key Challenges in production and sustainable strategies for cost reduction within a circular economy framework. Results Eng. 2025;26:105345. [CrossRef]
9. Ponnusamy VK, Nguyen DD, Dharmaraja J, Shobana S, Banu JR, Saratale RG, et al. A review on lignin structure, pretreatments, fermentation reactions and biorefinery potential. Bioresour Technol. 2019;271:462-72. [CrossRef]
10. Kathol M, Chowdhury NB, Immethun C, Alsiyabi A, Morris D, Naldrett MJ, et al. High enzyme promiscuity in lignin degradation mechanisms in Rhodopseudomonas palustris CGA009. Appl Environ Microbiol. 2025;91:0057325. [CrossRef]
11. Brown B, Immethun C, Wilkins M, Saha R. Rhodopseudomonas palustris CGA009 polyhydroxybutyrate production from a lignin aromatic and quantification via flow cytometry. Bioresour Technol Rep. 2020;11:100474. [CrossRef]
12. Brown B, Wilkins M, Saha R. Rhodopseudomonas palustris:A biotechnology chassis. Biotechnol Adv. 2022;60:108001. [CrossRef]
13. Alsiyabi A, Brown B, Immethun C, Long D, Wilkins M, Saha R. Synergistic experimental and computational approach identifies novel strategies for polyhydroxybutyrate overproduction. Metab Eng. 2021;68:1-13. [CrossRef]
14. Larimer FW, Chain P, Hauser L, Lamerdin J, Malfatti S, Do L, et al. Complete genome sequence of the metabolically versatile photosynthetic bacterium Rhodopseudomonas palustris. Nat Biotechnol. 2004;22:55-61. CrossRef]
15. Mazny BE, Sheff OF, LaSarre B, McKinlay A, McKinlay JB. Complete genome sequence of Rhodopseudomonas palustris CGA0092 and corrections to the R. CGA009 genome sequence. Microbiol Resour Announc. 2023;12:0128522. [CrossRef]
16. Brown B, Immethun C, Alsiyabi A, Long D, Wilkins M, Saha R. Heterologous phasin expression in Rhodopseudomonas palustris CGA009 for bioplastic production from lignocellulosic biomass. Metab Eng Commun. 2022;14:00191. [CrossRef]
17. Pan M, Colpo RA, Roussou S, Ding C, Lindblad P, Kromer JO. Engineering a photoautotrophic microbial coculture toward enhanced biohydrogen production. Environ Sci Technol. 2025;59:337-48. [CrossRef]
18. Hanisch J, Waltermann M, Robenek H, Steinbuchel A. The Ralstonia eutropha H16 phasin PhaP1 is targeted to intracellular triacylglycerol inclusions in Rhodococcus opacus PD630 and Mycobacterium smegmatis mc2155, and provides an anchor to target other proteins. Microbiology (Reading). 2006;152:3271-80. [CrossRef]
19. Potter M, Muller H, Steinbuchel A. Influence of homologous phasins (PhaP) on PHA accumulation and regulation of their expression by the transcriptional repressor PhaR in Ralstonia eutropha H16. Microbiology (Reading). 2005;151:825-33. [CrossRef]
20. Brown B, Immethun C, Wilkins M, Saha R. Biotechnical applications of phasins:Small proteins with large potential. Renew Sustain Energy Rev. 2022;158:112129. [CrossRef]
21. Mezzina MP, Alvarez DS, Egoburo DE, Pena RD, Nikel PI, Pettinari MJ. A new player in the biorefineries field:Phasin PhaP enhances tolerance to solvents and boosts ethanol and 1,3-propanediol synthesis in Escherichia coli. Appl Environ Microbiol. 2017;83:00662-17. [CrossRef]
22. Sharma PK, Fu J, Spicer V, Krokhin OV, Cicek N, Sparling R, et al. Global changes in the proteome of Cupriavidus necator H16 during poly-(3-hydroxybutyrate) synthesis from various biodiesel by-product substrates. AMB Express. 2016;6:36. [CrossRef]
23. Tang R, Peng X, Weng C, Han Y. The overexpression of phasin and regulator genes promoting the synthesis of polyhydroxybutyrate in Cupriavidus necator H16 under nonstress conditions. Appl Environ Microbiol. 2022;88:0145821. [CrossRef]
24. Zhao H, Yao Z, Chen X, Wang X, Chen GQ. Modelling of microbial polyhydroxyalkanoate surface binding protein PhaP for rational mutagenesis. Microb Biotechnol. 2017;10:1400-11. [CrossRef]
25. Li R, Yang J, Xiao Y, Long L. In vivo immobilization of an organophosphorus hydrolyzing enzyme on bacterial polyhydroxyalkanoate nano-granules. Microb Cell Fact. 2019;18P:166. [CrossRef]
26. Meng N, Yu BJ. Proteomics-based investigation of salt-responsive mechanisms in roots of Bradyrhizobium japonicum-inoculated Glycine max and Glycine soja seedlings. J Plant Growth Regul. 2018;37:266-77. [CrossRef]
27. Alves LP, Amaral FP, Kim D, Bom MT, Gavidia MP, Teixeira CS, et al. Importance of poly-3-hydroxybutyrate metabolism to the ability of Herbaspirillum seropedicae to promote plant growth. Appl Environ Microbiol. 2019;85:02586-18. [CrossRef]
28. Mezzina MP, Pettinari MJ. Phasins, multifaceted polyhydroxyalkanoate granule-associated proteins. Appl Environ Microbiol. 2016;82:5060-7. [CrossRef]
29. Kathol M, Immethun C, Saha R. Protocol to develop a synthetic biology toolkit for the non-model bacterium R.. STAR Protoc. 2023;4:102158. [CrossRef]
30. Livak KJ, Schmittgen TD. Analysis of relative gene expression data using real-time quantitative PCR and the 2(-Delta Delta C(T)) method. Methods. 2001;25:402-8. [CrossRef]
31. Takác T, Pechan T, ŠamajováO, Šamaj J. Proteomic analysis of arabidopsis Pld a 1 mutants revealed an important role of phospholipase D alpha 1 in chloroplast biogenesis. Front Plant Sci. 2019;10:89. [CrossRef]
32. Ishihama Y, Oda Y, Tabata T, Sato T, Nagasu T, Rappsilber J, et al. Exponentially modified protein abundance index (emPAI) for estimation of absolute protein amount in proteomics by the number of sequenced peptides per protein. Mol Cell Proteomics. 2005;4:1265-72. [CrossRef]
33. Pfeiffer D, Jendrossek D. Localization of poly(3-Hydroxybutyrate) (PHB) granule-associated proteins during PHB granule formation and identification of two new phasins, phap6 and phap7, in Ralstonia eutropha H16. J Bacteriol. 2012;194:5909-21. [CrossRef]