
1. INTRODUCTION
Indonesia’s pharmaceutical raw material (PRM) supply is heavily reliant on imports, highlighting the need to explore local natural resources. Justicia gendarussa Burm.f. (gandarusa), a wild shrub with a rich history in traditional medicine, is a promising candidate for PRM development. Known for its pharmacological properties, including antioxidant, anti-inflammatory, anticancer, and hepatoprotective properties, gandarusa contains bioactive compounds, such as alkaloids, triterpenoids, tannins, phenols, and flavonoids, making it a valuable resource for pharmaceutical applications [1].
Optimizing the bioactivity of gandarusa in its natural state remains challenging, as its bioactive compounds are often present in bound or inactive forms. Previous study by Suminto et al. has demonstrated that solid-state fermentation (SSF) can enhance the bioactivity of plant-derived compounds by increasing their bioavailability and bioactivity [2]. Numerous microorganisms, particularly fungi, have been widely employed as biocatalysts in SSF. Fungi are often favored in this process because of their lower water requirements than bacteria, which align with the minimal water usage inherent to this technique.
Several studies have reported that fungal species, such as Aspergillus niger, Monascus spp., Saccharomyces cerevisiae, and Aspergillus oryzae, are effective for SSF applications [3]. Among these, A. oryzae has distinct advantages. In addition to its widespread use in fermented foods and attesting to its safety, A. oryzae exhibits robust enzymatic activity that has been shown to enhance both the quantity and quality of secondary metabolites in a variety of food substrates and herbal matrices [3,4]. For instance, SSF employing A. oryzae has been reported to increase the total phenolic content (TPC) and antioxidant activity of rice bran, turmeric, and Moringa oleifera [5-7]. Similarly, fermentation with A. oryzae successfully improved the levels of quercetin and kaempferol in mulberry leaves, suggesting its potential to enhance plant-derived bioactive [8].
Although previous studies have demonstrated that A. oryzae can enhance the phenolic content and antioxidant properties of various herbs, comprehensive research on optimizing the fermentation conditions for gandarusa is lacking. To address this knowledge gap, this study aimed to optimize SSF conditions for gandarusa using A. oryzae. Because SSF involves complex microbial activities influenced by numerous environmental and technical factors, selecting the most critical parameters is important.
Previous studies have identified incubation time, temperature, moisture content, and inoculum concentration as critical parameters that contribute to metabolite production and enhancement of bioactivities in SSF [8-12]. In this study, these parameters were systematically investigated to determine the maximum TPC, flavonoid content, and antioxidant capacity. These findings are expected to provide a foundation for the development of gandarusa-based pharmaceutical raw materials, thereby contributing to the sustainability of Indonesia’s pharmaceutical industry.
2. MATERIALS AND METHODS
2.1 Microorganism and Materials
The fungal isolate A. oryzae IPBCC was obtained from the IPB Culture Collection, IPB University, Indonesia, for use in the fermentation process. The primary material, J. gendarussa Burm.f. (gandarusa), was sourced from the Tropical Biopharmaca Research Center, IPB University, Indonesia.
2.2. Water Content Analysis of Gandarusa
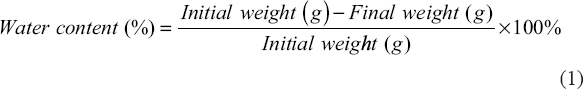
The water content of gandarusa leaves was analyzed to determine the initial moisture content, which can influence the fermentation process. Porcelain dishes were preheated at 105°C in an oven for 30 min to remove residual moisture and then cooled in a desiccator for 30 min before weighing. A 2 g sample of powdered gandarusa leaves was placed in a porcelain dish and heated at 105°C for 3 h. After cooling in a desiccator, the sample was reweighed until a constant weight was achieved. Moisture content was calculated using following the equation (1):
 |
2.3. Preparation of A. oryzae Inoculum
Inoculum was prepared according to the method described by Suminto et al. [9]. A. oryzae cultures were grown on potato dextrose agar and incubated at 25°C for 7 d to promote spore formation. Spores were collected using a cork borer (10 mm in diameter), forming medium discs that were transferred into culture tubes containing 20% glycerol solution. The culture tubes were stored at −20°C to maintain the viability of the inoculum.
2.4. Solid-State Fermentation of Gandarusa
Solid-state fermentation was conducted to enhance the content of bioactive compounds in gandarusa. Ten grams of powdered gandarusa leaves were placed in a 250 mL Erlenmeyer flask and mixed with 10 mL distilled water. The mixture was sterilized in an autoclave at 121°C for 15 min. The fermentation formulations were designed using Design-Expert software, incorporating four key variables: incubation time (3–14 d), temperature (30–45°C), moisture content (20–80%), and inoculum concentration (20–100%).
As summarized in Table 1, eleven formulations were generated with three central points at formulas 3, 5, and 6. The moisture content was adjusted by adding 2–8 mL of sterile water, and 20% moisture content was achieved with the addition of 2 mL of water. The inoculum concentration was controlled by adding A. oryzae discs with a 100% concentration equivalent to five discs per sample. The selection of this range (20–100%) was based on a preliminary investigation that suggested that lower fungal inoculum concentrations might result in inadequate colonization, whereas higher levels could potentially decrease fermentation efficiency due to competition for nutrients and limited oxygen availability [9,13]. Fermentation was performed under sterile conditions according to the experimental design, and each treatment was replicated thrice to ensure reliability.
Table 1: Fermentation formula and extract yields of gandarusa fermented with Aspergillus oryzae.
| Formula | Experimental condition | Experimental results | |||
|---|---|---|---|---|---|
| Incubation time (d) | Temperature (°C) | Moisture content (%) | Inoculum concentration (%) | Extract Yield (%) | |
| 1 | 3.0 | 40.0 | 80 | 20 | 7.72 |
| 2 | 14.0 | 30.0 | 80 | 20 | 5.53 |
| 3 | 8.5 | 37.5 | 50 | 60 | 8.43 |
| 4 | 3.0 | 30.0 | 80 | 100 | 7.76 |
| 5 | 8.5 | 37.5 | 50 | 60 | 7.83 |
| 6 | 8.5 | 37.5 | 50 | 60 | 9.23 |
| 7 | 14.0 | 45.0 | 20 | 20 | 7.69 |
| 8 | 14.0 | 45.0 | 80 | 100 | 9.70 |
| 9 | 3.0 | 45.0 | 20 | 100 | 10.21 |
| 10 | 3.0 | 30.0 | 20 | 20 | 5.74 |
| 11 | 14.0 | 30.0 | 20 | 100 | 5.08 |
2.5. Extraction of Fermented Gandarusa
Fermented gandarusa was extracted by maceration for 24 h to obtain the bioactive compounds. Methanol was used as the solvent with a leaf powder-to-solvent ratio of 1:10 (w/v). The extract was filtered to separate the filtrate from the residue and the filtrate was concentrated using a rotary evaporator at 40°C and 100 rpm. The concentrated extract was stored at 4°C to prevent degradation during the long-term storage. The extraction yield was calculated as a percentage, using the following equation (2):
 |
2.6. Determination of Total Phenolic Content (TPC)
The TPC was measured using the Folin–Ciocalteu method. A 20 μL aliquot of the fermented extract was mixed with 120 μL of 10% Folin–Ciocalteu reagent in a 96-well microplate, incubated for 5 min of incubation at room temperature. Subsequently, 80 μL of 10% Na2CO3 solution was added, and the mixture was incubated for 30 min. As a control, the TPC was also determined on the unfermented gandarusa. Absorbance was measured at 750 nm using a spectrophotometer. A standard curve was prepared with gallic acid concentrations of 0, 50, 75, 100, 150, 200, and 225 μg/mL following the same procedure as the samples. TPC was expressed as milligram gallic acid equivalents per gram dry weight (mg GAE/g DW) and calculated using following equation (3):
 |
where:
C = Total phenolic content (mg GAE/g DW)
c = Concentration of total phenolic from standard curve (mg/L)
V = Volume of sample (L)
m = Weight of sample (g)
DF = Dilution factor
2.7. Determination of Total Flavonoid Content (TFC)
TFC was determined using the aluminum chloride (AlCl3) method. In a 96-well microplate, 10 μL of the extract was mixed with 60 μL methanol, 10 μL of 10% AlCl3, 10 μL of 1 M CH3COOK, and 120 μL distilled water. After 30 min of incubation at room temperature, absorbance was measured at 415 nm. As a control, the TFC was also determined on the unfermented gandarusa. A quercetin calibration curve (0, 100, 150, 200, 250, 300, 400, and 500 ppm) was prepared and TFC was expressed as milligram quercetin equivalents per gram dry weight (mg QE/g DW) using equation (4):
 |
where:
C = Total flavonoid concentration (mg QE/g DW)
c = Total phenolic concentration from the standard curve (mg/L)
V = Volume of sample (L)
m = Weight of sample (g)
DF = Dilution factor
2.8. Antioxidant Capacity by 2,2-Diphenyl-1-Picrylhydrazyl (DPPH) Method
DPPH scavenging activity was measured by adding 100 μL of 125 μM DPPH solution (in methanol) to 100 μL of extract. After 30 min of incubation at room temperature in the dark, absorbance was measured at 517 nm. As a control, the antioxidant capacity by DPPH was also determined on the unfermented gandarusa. Trolox calibration standards (0–100 μM) were used. Antioxidant activity was expressed as μmol Trolox equivalents per gram of dry weight extract (μmol TE/g DW) using equation (5):
 |
where:
C = Antioxidant activity (μmol TE/g DW)
c = Concentration of sample from standard curve (μM trolox)
V = Volume of sample volume (L)
m = Weight of sample (g)
DF = Dilution factor
2.9. Antioxidant Capacity by Ferric Reducing Antioxidant Power (FRAP) Method
The FRAP assay was conducted following the method described by Batubara et al. [14]. FRAP reagent was prepared by mixing 10 mM 2,4,6-tris(2-pyridyl)-(S)-triazine (TPTZ) in 300 mM acetate buffer (pH 3.6), 20 mM ferric chloride, and 40 mM hydrochloric acid in a 10:1:1 ratio. Twenty microliters of extract were mixed with 280 μL FRAP reagent and incubated at 37°C in the dark for 30 min. The absorbance was measured at 593 nm. As a control, the antioxidant activity by FRAP was also determined on the unfermented gandarusa. Trolox calibration standards (0–400 μM) were used. Antioxidant activity was expressed as μmol TE/g DW using following equation (6):
 |
where:
C = Antioxidant activity (μmol TE/g DW)
c = Total phenolic concentration of the sample from the standard curve (mg/L)
V = Volume of sample (L)
m = Weight of sample (g)
DF = Dilution factor
2.10. Data Analysis
Experimental data, including TPC, TFC, and antioxidant capacities (DPPH and FRAP), were analyzed using one-way analysis of variance (ANOVA) with a 95% confidence level. The optimization of fermentation was performed using Design-Expert v.13.0 software. The optimal formulation was selected based on the highest desirability value.
3. RESULTS AND DISCUSSION
3.1. Water Content of Simplisia and Yield of Fermented Gandarusa
The water content of gandarusa simplisia was determined to enhance the efficiency of the extraction process, prevent the degradation of active compounds, and optimize the storage and isolation of bioactive compounds. The results showed that the average water content of gandarusa simplisia was 9.05 ± 0.14%. Subsequently, 10 g of gandarusa simplisia was fermented using A. oryzae under specific conditions and extracted using methanol through a maceration method.
As summarized in Table 1, formula 9 produced the highest extract yield of 10.21%, whereas formula 11 yielded the lowest extract yield of 5.08%. These findings indicate that fermenting gandarusa for 3 days at 30°C, 20% moisture content, and 100% inoculum concentration resulted in the highest extract yield compared to the other fermentation conditions tested. The yield reflects the amount of compounds extracted using methanol through maceration. Previous studies have reported a positive correlation between extract yield and TPC, TFC, and antioxidant capacity [15]. However, other studies have also indicated that there is not always a positive correlation between the yield and bioactivity of compounds in plant extracts [16].
3.2. TPC and TFC of Fermented Gandarusa
The TPC of fermented gandarusa was determined using the Folin-Ciocalteu method, with gallic acid as the standard [17]. Gallic acid was selected because of its phenolic nature, simple structure, and ability to react efficiently with Folin-Ciocalteu reagent to form a measurable color complex at a specific wavelength [18]. TPC was expressed as mg GAE/g DW.
As summarized in Table 2, the TPC of unfermented gandarusa was 0.810 mg GAE/g DW, which was significantly lower than the TPC of fermented gandarusa, averaging 3.056 mg GAE/g DW. This result indicated that solid-state fermentation increased the TPC of gandarusa by approximately threefold. Similar increases in TPC following solid-state fermentation were reported by Cao et al. [19], who studied the effects of fermentation using A. oryzae, A. niger, and Monascus purpureus on Apocynum venetum L. Among these microorganisms, A. niger produced the highest increase in TPC.
Table 2: TPC, TFC, and antioxidant capacity of unfermented and fermented gandarusa.
| Formula | TPC (mg GAE/g DW) | TFC (mg QE/g DW) | Antioxidant capacity (DPPH) (μmol TE/g DW) | Antioxidant capacity (FRAP) (μmol TE/g DW) |
|---|---|---|---|---|
| 0 | 0.810 | 1.272 | 0.267 | 0.633 |
| 1 | 3.925 | 0.688 | 0.397 | 1.194 |
| 2 | 4.588 | 1.588 | 0.243 | 1.384 |
| 3 | 3.226 | 0.720 | 0.461 | 1.241 |
| 4 | 2.317 | 0.476 | 0.335 | 0.604 |
| 5 | 4.183 | 0.900 | 0.400 | 1.203 |
| 6 | 1.819 | 0.737 | 0.371 | 0.853 |
| 7 | 5.226 | 0.899 | 0.369 | 1.598 |
| 8 | 2.962 | 0.379 | 0.392 | 0.749 |
| 9 | 1.865 | 0.739 | 0.414 | 0.448 |
| 10 | 2.027 | 0.309 | 0.262 | 0.563 |
| 11 | 1.478 | 0.133 | 0.208 | 0.441 |
Formula 0: Unfermented gandarusa (negative control). DPPH: Antioxidant capacity measured by DPPH (2,2-diphenyl-1-picrylhydrazyl) method. FRAP: Antioxidant capacity measured by ferric reducing antioxidant power, TPC: Total phenolic content, TFC: Total flavonoid content, mg GAE/g DW: Milligram gallic acid equivalents per gram dry weight, mg QE/g DW: Milligram quercetin equivalents per gram dry weight
Among the 11 fermentation formulas, formula 7 yielded the highest TPC at 5.226 mg GAE/g DW, whereas formula 11 exhibited the lowest TPC at 1.478 mg GAE/g DW. These results demonstrated that TPC in gandarusa can increase up to five-fold through solid-state fermentation with A. oryzae under optimal conditions: 14 d of incubation at 45°C, 20% moisture content, and 20% inoculum concentration.
Puspitasari et al. [7] and Akbari et al. [20] also reported TPC enhancement under different fermentation conditions. Puspitasari optimized the fermentation of Moringa oleifera seed flour with A. oryzae at 30°C for 3 days and inoculum volume of 1.25 mL (7.5 × 10⁶ spores), while Akbari fermented corn bran using Lactobacillus reuteri for 3 days at 35°C, 60% moisture content, and an inoculum volume of 2 mL (2 × 10⁷ CFU). Similarly, Ozdemir et al. [21] found that solid-state fermentation of hazelnut oil cake with A. oryzae increased TPC, with optimal conditions of 4.6 d of incubation at 24.6°C, 69.8% moisture content, and inoculum ratio 107 spores/g dry matter of solid substrate (1.5 × 10⁶ spores).
In contrast, TFC decreased from 1.272 mg QE/g DW in unfermented gandarusa to an average of 0.688 mg QE/g DW after fermentation. Only formula 2 (14 d at 30°C, 80% moisture content, and 20% inoculum) showed a slight, non-significant increase to 1.588 mg QE/g DW. Similar TFC reductions have been reported in studies of green tea and Saccharina japonica fermentation by A. oryzae [22,23].
The increase in TPC and decline in TFC during gandarusa fermentation suggests metabolic transformations driven by A. oryzae. For example, Kim et al. [22] reported that gallotannin degradation in green tea releases gallic acid, increasing TPC but reducing TFC due to the breakdown of epigallocatechin-3-gallate (EGCG). The conversion of EGCG to phenolic compounds such as caffeoylquinic acid, kaempferol rutinoside, and 3-p-coumaroylquinic acid has been documented in previous studies. However, it is important to note that these specific phenolic derivatives were not quantified in the present study.
3.3. Antioxidant Capacity of Fermented Gandarusa using DPPH and FRAP Assays
Antioxidant capacity was evaluated using two approaches: The DPPH radical scavenging assay and FRAP assay. Trolox, a vitamin E analog, was employed as the standard for both methods because of its reliable reactivity with reagents, providing consistent and accurate data [24]. The results are expressed in micromoles of Trolox equivalents per gram of dry weight (μmol TE/g DW).
As shown in Table 2, the antioxidant capacity of the unfermented gandarusa was 0.267 μmol TE/g DW using the DPPH method and 0.633 μmol TE/g DW using the FRAP method. Solid-state fermentation with A. oryzae enhanced the antioxidant capacity, yielding average values of 0.350 μmol TE/g DW (DPPH) and 0.934 μmol TE/g DW (FRAP). Both methods demonstrated an increase in antioxidant capacity after fermentation.
The DPPH assay revealed that formula 3, which involved fermentation for 8.5 days at 37.5°C, 50% moisture content, and 60% inoculum concentration, exhibited the highest antioxidant capacity, reaching 0.435 μmol TE/g DW. In contrast, the FRAP assay identified formula 7 as having the highest antioxidant capacity among all the tested formulas, achieving 1.598 μmol TE/g DW. This indicated that fermentation for 14 days at 45°C, 20% moisture content, and 20% inoculum concentration resulted in optimal enhancement of antioxidant capacity when assessed using the FRAP method.
The differences in the results between the DPPH and FRAP methods can be attributed to their distinct reaction mechanisms and potential interference from fermentation metabolites [25]. The DPPH method measures the antioxidant activity based on the ability of compounds to donate hydrogen atoms, thereby neutralizing free radicals. In contrast, the FRAP method evaluates the reducing power of antioxidants by assessing their capacity to reduce Fe3+ to Fe2+, which is more responsive to compounds with high redox potentials [26]. In addition, fermentation-derived metabolites, such as organic acids and peptides, may differentially affect these assays by either enhancing or inhibiting their respective reactions, leading to observed discrepancies [4,27].
After fermentation, antioxidant capacity measured by DPPH and FRAP methods showed a strong correlation with TPC, confirming that phenolic compounds are the primary contributors to antioxidant activity [28-30]. Although flavonoids also influence antioxidant activity, the observed decrease in TFC post-fermentation did not diminish antioxidant capacity. Instead, an increase in non-flavonoid phenolic compounds likely enhanced this effect.
Phenolic compounds neutralize free radicals (e.g., OH•, NO2•, and ONOOH) by donating hydrogen atoms [31]. Functional groups such as -CH2COOH, -CH=CHCOOH, methoxy (-OCH3), and hydroxyl (-OH) further boost antioxidant activity by lowering the bond dissociation enthalpy and facilitating electron transfer [32]. This mechanism underscores the critical role of phenolic compounds in the antioxidant systems.
3.4. Effect of Solid-State Fermentation Factors on Response Variables
To evaluate the effects of fermentation factors (incubation time [A], temperature [B], moisture content [C], and inoculum concentration [D]) on TPC, TFC, and antioxidant capacity (DPPH and FRAP methods), a correlation analysis was performed using Design-Expert software with a two-level fractional factorial design. ANOVA was used to select the appropriate model, with a significance level of P < 0.05 (indicating statistical significance) and a lack-of-fit F-value > 0.05 (indicating non-significant lack-of-fit), suggesting a good model fit [33]. In addition, the effects of fermentation factors were identified based on their percentage contributions to the response variables. Higher percentage contributions indicate greater effects on the response variables.
As shown in Table 3, model D (inoculum concentration) had the highest significant impact on the TFC, as indicated by a P-value of 0.0219 (P < 0.05). For TPC, inoculum concentration also had the greatest effect, contributing the highest percentage among the fermentation factors (60.11%). As illustrated in Figure 1, TPC was the highest at 20% inoculum concentration, whereas higher concentrations led to decreased phenolic content. Meanwhile, Figure 2 shows the effects of solid fermentation factors on TFC. The interaction between incubation time and inoculum concentration significantly influenced the TFC (P = 0.0184), with an insignificant lack-of-fit F-value (52.89), indicating model adequacy. The highest TFC was observed at 20% inoculum concentration, with lower inoculum concentrations and longer fermentation times tending to increase the TFC.
Table 3: P-values and percentage contribution of fermentation factors on TPC, TFC, and antioxidant capacity (DPPH and FRAP) responses.
| Fermentation factors | P-value | Contribution (%) | ||||||
|---|---|---|---|---|---|---|---|---|
| TPC | TFC | DPPH | FRAP | TPC | TFC | DPPH | FRAP | |
| A-Incubation time (d) | 0.3450 | 0.1461 | 0.2104 | 0.1736 | 14.17 | 3.66 | 11.39 | 11.96 |
| B-Temperature (°) | 0.4529 | 0.4022 | 0.0585 | 0.2438 | 8.06 | 0.76 | 53.65 | 7.42 |
| C-Moisture content (%) | 0.4589 | 0.0533 | 0.3546 | 0.2513 | 7.81 | 11.74 | 4.91 | 7.09 |
| D-Inoculum concentration (%) | 0.1752 | 0.0219 | 0.8136 | 0.0513 | 60.11 | 30.00 | 0.25 | 49.97 |
| AB | 0.8599 | 0.0597 | 0.7464 | 0.9493 | 0.38 | 10.39 | 0.47 | 0.01 |
| AC | 0.7178 | 0.1355 | 0.7853 | 0.3262 | 1.63 | 4.03 | 0.33 | 4.62 |
| BC | 0.4321 | N/A | N/A | N/A | 9.98 | N/A | N/A | N/A |
| AD | N/A | 0.0184 | 0.6961 | 0.2459 | N/A | 35.98 | 0.70 | 7.32 |
N/A: Not available, TPC: Total phenolic content, TFC: Total flavonoid content, DPPH: 2,2-diphenyl-1-picrylhydrazyl, FRAP: Ferric antioxidant power
 | Figure 1: Analysis of the effect of inoculum concentration on total phenolic content. [Click here to view] |
 | Figure 2: Analysis of the effect of inoculum concentration and incubation time on the response of total flavonoid content. [Click here to view] |
The effect of fermentation factors on the antioxidant capacity (DPPH) was assessed based on the percentage contribution and P-value. As shown in Table 3, temperature significantly affected DPPH with a percentage contribution of 53.65%. This was the highest among the fermentation factors, with a P-value of 0.0513. The highest DPPH antioxidant capacity was observed at 37.5°C (0.461 μmol TE/g DW), compared to 0.208 μmol TE/g DW at 30°C, indicating that higher fermentation temperatures enhanced antioxidant capacity [Figure 3].
 | Figure 3: Analysis of the effect of temperature factor on the 2,2-diphenyl-1-picrylhydrazyl antioxidant capacity response. [Click here to view] |
The effect of solid fermentation factors on the antioxidant capacity, measured using the FRAP method, is shown in Figure 4. Correlation analysis revealed that model D (inoculum concentration) contributed the highest percentage of the factors (49.97%). This result indicated that, at an inoculum concentration of 20%, the FRAP antioxidant capacity was the highest, reaching 1.598 μmoL TE/g DW. In contrast, at an inoculum concentration of 100%, FRAP antioxidant capacity decreased. This suggests that lower inoculum concentrations in solid fermentation led to a higher FRAP antioxidant capacity.
 | Figure 4: Analysis of the effect of inoculum concentration on ferric antioxidant power antioxidant capacity. [Click here to view] |
Overall, the correlation analysis identified inoculum concentration as the most influential fermentation factor affecting TPC, TFC, and FRAP antioxidant capacity. This supports previous studies showing that larger inoculum sizes increase the total phenolic and flavonoid content [34]. In addition to inoculum concentration, temperature and incubation time significantly influenced fermentation, particularly by promoting A. oryzae growth and metabolite production in the gandarusa. These findings align with those of Sulasiyah et al. [6] and Suminto et al. [9], who reported that the incubation time significantly affected metabolite production.
3.5. Optimization of Gandarusa Fermentation
The TPC, TFC, and antioxidant capacity (measured by DPPH and FRAP assays) were analyzed using the Design Expert software to determine the optimal fermentation conditions. Based on this analysis, a new formulation was identified by optimizing the ratios of the incubation time, incubation temperature, moisture content, and inoculum concentration. The selected solution achieved the highest desirability value, where a value of 1 represents the optimum condition and values approaching 0 indicate undesired conditions.
In this study, the highest desirability value was 0.862, corresponding to optimal fermentation conditions of 14 days of incubation, fermentation temperature of 45°C, 80% moisture content, and 20% inoculum concentration. This formulation was predicted to yield the highest responses in terms of the TPC, TFC, and antioxidant capacity. Specifically, the predicted TPC was 4.726 mg GAE/g DW, TFC was 1.365 mg QE/g DW, and antioxidant capacities were 0.398 μmol TE/g DW (DPPH) and 1.644 μmol TE/g DW (FRAP).
Notably, our results indicate that the optimal fermentation temperature for A. oryzae, as suggested by the desirability value, exceeds the conventional optimal growth range of 32–36°C [35]. Although cultivation outside this range may adversely affect growth, recent research on cigar tobacco leaves has shown that higher temperatures (>45°C) can promote the establishment of microbial communities, including Aspergillus [36]. This finding suggests that fermentation temperature not only influences microbial proliferation but also shapes distinct community structures, ultimately affecting the production of physicochemical metabolites. Jiang et al. [37] reported that under high-temperature conditions (>42°C), genes involved in glucose, sucrose, and galactose metabolism in A. oryzae were downregulated. This downregulation may enhance the adaptability of fungi to elevated temperatures by reducing oxidative stress-related damage. In addition, the protease produced by A. oryzae exhibited thermal stability, with an optimum activity temperature of 57.2°C [38]. This is particularly noteworthy, as proteases can hydrolyze proteins and thereby release antioxidant compounds from protein-based substrates.
Furthermore, batch-to-batch variations may arise because of the inherent biological variability in fungal metabolism. Differences in the growth kinetics and enzymatic activity can affect the stability and production of bioactive compounds [39,40]. To address these reproducibility concerns, implementing process standardization through consistent inoculum preparation, strict control of fermentation parameters, and continuous monitoring can help minimize batch variations and enhance overall process reliability [40,41].
4. CONCLUSION
Solid-state fermentation by A. oryzae has been shown to effectively increased the TPC and antioxidant capacity of gandarusa (J. gendarussa Burm. f). However, this fermentation process tends to reduce the TFC of the gandarusa. Correlation analysis and design solutions indicated that the optimal fermentation conditions for achieving the highest combined TPC, TFC, and antioxidant capacity were 14 days of fermentation at 45°C, 80% moisture content, and 20% inoculum concentration. Future research should involve an experimental verification to confirm the proposed optimal design.
5. ACKNOWLEDGMENT
This research was financially supported by the Ministry of Research, Technology, and Higher Education, Republic of Indonesia for research funding through the Penelitian Fundamental Reguler (PFR) 2024 scheme under contract 22089/IT3.D10/PT.01.03/P/B/2024.
6. AUTHORS’ CONTRIBUTIONS
All authors made substantial contributions to conception and design, acquisition of data, or analysis and interpretation of data; took part in drafting the article or revising it critically for important intellectual content; agreed to submit to the current journal; gave final approval of the version to be published; and agreed to be accountable for all aspects of the work. All the authors are eligible to be authors as per the International Committee of Medical Journal Editors (ICMJE) requirements and guidelines.
7. CONFLICTS OF INTEREST
The authors report no financial or any other conflicts of interest in this work.
8. ETHICAL APPROVALS
This study does not involve experiments on animals or human subjects.
9. DATA AVAILABILITY
All the data is available with the authors and shall be provided upon request.
10. PUBLISHER’S NOTE
All claims expressed in this article are solely those of the authors and do not necessarily represent those of the publisher, the editors and the reviewers. This journal remains neutral with regard to jurisdictional claims in published institutional affiliation.
11. USE OF ARTIFICIAL INTELLIGENCE (AI)-ASSISTED TECHNOLOGY
The authors declares that they have not used artificial intelligence (AI)-tools for writing and editing of the manuscript, and no images were manipulated using AI.
REFERENCES
1. Souza LG, Almeida SM, Lemos TL, Ribeiro PR, Canuto KM, Braz-Filho R, et al. Brazoides A-D, new alkaloids from Justicia gendarussa burm. F. Species. J Braz Chem Soc 2017;28:1281-7.[CrossRef]
2. Suminto S, Takatsuji E, Iguchi A, Kanzaki H, Okuda T, Nitoda T. A new asteltoxin analog with insecticidal activity from Pochonia suchlasporia TAMA 87. J Pest Sci 2020;45:81-5.[CrossRef]
3. Soccol CS, Costa ES, Letti LA, Karp SG, Woiciechowski AL, Vandenberghe LP. Recent developments and innovations in solid state fermentation. Biotechnol Res Innov 2017;1:52-71.[CrossRef]
4. Yafetto L. Application of solid-state fermentation by microbial biotechnology for bioprocessing of agro-industrial wastes from 1970 2020:A review and bibliometric analysis. Heliyon 2022;8:09173.[CrossRef]
5. Punia S, Sandhu KS, Grasso S, Purewal SS, Kaur M, Siroha AK, et al. Aspergillus oryzae fermented rice bran:A byproduct with enhanced bioactive compounds and antioxidant potential. Foods 2020;10:70.[CrossRef]
6. Sulasiyah S, Sarjono PR, Aminin AL. Antioxidant from turmeric fermentation products (Curcuma longa) by Aspergillus oryzae. J Sci Appl Chem 2018;21:13-8.[CrossRef]
7. Puspitasari C, Pinsirodom P, Wattanachaisaereekul S. Effect of solid-state fermentation using Aspergillus oryzae and Aspergillus niger on bitter and bioactive compounds of Moringa oleifera seed flour. LWT 2024;207:116616.[CrossRef]
8. Guo N, Zhu YW, Jiang YW, Li HK, Liu ZM, Wang W, et al. Improvement of flavonoid aglycone and biological activity of mulberry leaves by solid-state fermentation. Ind Crop Prod 2020;148:112287.[CrossRef]
9. Suminto S, Huang AA, Hasanah U, Nurcholis W. Optimizing solid-state fermentation for metabolite enrichment by Aspergillus tamarii on rice bran and wheat. J Appl Biol Biotechnol 2024;12:195-202.[CrossRef]
10. Gao YL, Wang CS, Zhu QH, Qian GY. Optimization of solid-state fermentation with Lactobacillus brevis and Aspergillus oryzae for trypsin inhibitor degradation in soybean meal. J Integr Agric 2013;12:869-76.[CrossRef]
11. Rashid NY, Jamaluddin A, Ghani AA, Razak DL, Jonit J, Mansor A, et al. Quantification of phenolic compounds changes by Aspergillus oryzae on rice bran fermentation. Food Res 2019;3:133-7.[CrossRef]
12. Villasante J, Espinosa-Ramírez J, Pérez-Carrillo E, Heredia-Olea E, Almajano M. Extrusion and solid-state fermentation with Aspergillus oryzae on the phenolic compounds and radical scavenging activity of pecan nut (Carya illinoinensis) shell. Br Food J 2021;123:4367-82.[CrossRef]
13. Meyrath J. Influence of the size of inoculum on various growth phases in Aspergillus oryzae. Antonie Van Leeuwenhoek 1963;29:57-78.[CrossRef]
14. Batubara I, Komariah K, Sandrawati A, Nurcholis W. Genotype selection for phytochemical content and pharmacological activities in ethanol extracts of fifteen types of Orthosiphon aristatus (Blume) Miq. Leaves using chemometric analysis. Sci Rep 2020;10:20945.[CrossRef]
15. Turker I, Isleroglu H. Optimization of extraction conditions of bioactive compounds by ultrasonic-assisted extraction from artichoke wastes. Acta Chim Slov 2021;68:658-66.[CrossRef]
16. Legesse AB, Emire SA, Tadesse MG, Dadi DW, Kassa SK, Oyinloye TM, et al. Optimization of ultrasound-assisted extraction of Verbascum sinaiticum leaves:Maximal phenolic yield and antioxidant capacity. Foods 2024;13:1255.[CrossRef]
17. Rafi M, Pertiwi TY, Syaefudin S. Determination of total phenolic content and antioxidant activity of six ornamental plants. J Sci App Chem 2019;22:79-84.[CrossRef]
18. Pérez M, Dominguez-López I, Lamuela-Raventós RM. The chemistry behind the Folin-Ciocalteu method for the estimation of (poly) phenol content in food:Total phenolic intake in a Mediterranean dietary pattern. J Agric Food Chem 2023;71:17543-53.[CrossRef]
19. Cao C, Lin D, Zhou Y, Li N, Wang Y, Gong W, et al. Solid-state fermentation of Apocynum venetum L. By Aspergillus niger:Effect on phenolic compounds, antioxidant activities and metabolic syndrome-associated enzymes. Front Nut 2023;10:1125746.[CrossRef]
20. Akbari M, Gómez-Urios C, Razavi SH, Khodaiyan F, Blesa J, Esteve MJ. Optimization of solid-state fermentation conditions to improve phenolic content in corn bran, followed by extraction of bioactive compounds using natural deep eutectic solvents. Innov Food Sci Emerg Technol 2024;93:103621.[CrossRef]
21. Ozdemir MB, K?l?çarslan E, Demir H, Koca E, Salum P, Berkta?S, et al. Upgrading the bioactive potential of hazelnut oil cake by Aspergillus oryzae under solid-state fermentation. Molecules 2024;29:4237.[CrossRef]
22. Kim MJ, John KM, Choi JN, Lee S, Kim AJ, Kim YM et al. Changes in secondary metabolites of green tea during fermentation by Aspergillus oryzae and its effect on antioxidant potential. Food Res Int 2013;53:670-7.[CrossRef]
23. Rafiquzzaman SM, Kong IS, Kim JM. Enhancement of antioxidant activity, total phenolic and flavonoid content of Saccharina japonica by submerged fermentation with Aspergillus oryzae. KSBB J 2015;30:27-32.[CrossRef]
24. Rumpf J, Burger R, Schulze M. Statistical evaluation of DPPH, ABTS, FRAP, and Folin-Ciocalteu assays to assess the antioxidant capacity of lignins. Int J Biol Macromol 2023;233:123470.[CrossRef]
25. Apak R, Özyürek M, GüçlüK, Çapano?lu E. Antioxidant activity/capacity measurement. 1. Classification, physicochemical principles, mechanisms, and electron transfer (ET)-based assays. J Agric Food Chem 2016;64:997-1027.[CrossRef]
26. Nwachukwu ID, Sarteshnizi RA, Udenigwe CC, Aluko RE. A concise review of current in vitro chemical and cell-based antioxidant assay methods. Molecules 2021;26:4865.[CrossRef]
27. Munteanu IG, Apetrei C. Analytical methods used in determining antioxidant activity:A review. Int J Mol Sci 2021;22:3380.[CrossRef]
28. Aryal S, Baniya MK, Danekhu K, Kunwar P, Gurung R, Koirala N. Total phenolic content, flavonoid content and antioxidant potential of wild vegetables from Western Nepal. Plants (Basel) 2019;8:96.[CrossRef]
29. Muflihah YM, Gollavelli G, Ling YC. Correlation study of antioxidant activity with phenolic and flavonoid compounds in 12 Indonesian indigenous herbs. Antioxidants (Basel) 2021;10:1530.[CrossRef]
30. Milella RA, De Rosso M, Gasparro M, Gigante I, Debiase G, Forleo LR, et al. Correlation between antioxidant and anticancer activity and phenolic profile of new Apulian table grape genotypes (V. L.). Front Plant Sci 2023;13:1064023.[CrossRef]
31. Kumar S, Sandhir R, Ojha S. Evaluation of antioxidant activity and total phenol in different varieties of Lantana camara leaves. BMC Res Notes 2014;7:560.[CrossRef]
32. Chen J, Yang J, Ma L, Li J, Shahzad N, Kim CK. Structure-antioxidant activity relationship of methoxy, phenolic hydroxyl, and carboxylic acid groups of phenolic acids. Sci Rep 2020;10:2611.[CrossRef]
33. Derawi D. Experimental design using response surface methods for palm olein-based hydroxy-ether synthesis. Sains Malays 2016;45:1149-54.
34. Tchabo W, Ma Y, Kwaw E, Zhang H, Li X. Influence of fermentation parameters on phytochemical profile and volatile properties of mulberry (Morus nigra) wine. JIB 2017;123:151-8.[CrossRef]
35. Gomi K. Aspergillus:Aspergillus oryzae. In:Batt CA, Tortorello ML, editors. Encyclopedia of Food Microbiology. New York:Academic Press;2014. 92-6.[CrossRef]
36. Jia Y, Guo S, Hu W, Zhang Q, Wang Y, Zhang Z, et al. Effects of different fermentation temperatures on microbiomes of cigar tobacco leaves. Front Bioeng Biotechnol 2025;13:1550383.[CrossRef]
37. Jiang C, Ge J, He B, Zhang Z, Hu Z, Li Y, et al. Transcriptomic analysis reveals Aspergillus oryzae responds to temperature stress by regulating sugar metabolism and lipid metabolism. PLoS One 2022;17:0274394.[CrossRef]
38. Castro RJ, Sato HH. Protease from Aspergillus oryzae:Biochemical characterization and application as a potential biocatalyst for production of protein hydrolysates with antioxidant activities. J Food Process 2014;2014:372352.[CrossRef]
39. Yang L, Shakeel Q, Xu X, Ali L, Chen Z, Mubeen M, et al. Optimized submerged batch fermentation for metabolic switching in Streptomyces yanglinensis 3-10 providing platform for reveromycin A and B biosynthesis, engineering, and production. Front Microbiol 2024;15:1378834.[CrossRef]
40. Jenzsch M, Gnoth S, Kleinschmidt M, Simutis R, Lübbert A. Improving the batch-to-batch reproducibility in microbial cultures during recombinant protein production by guiding the process along a predefined total biomass profile. Bioprocess Biosyst Eng 2006;29:315-21.[CrossRef]
41. Cruz-Casas DE, Aguilar CN, Ascacio-Valdés JA, Rodríguez-Herrera R, Chávez-González ML, Flores-Gallegos AC. Enzymatic hydrolysis and microbial fermentation:The most favorable biotechnological methods for the release of bioactive peptides. Food Chem (Oxf) 2021;3:100047.[CrossRef]