
1. INTRODUCTION
Non-small cell lung cancer (NSCLC) accounts for almost 84% of diagnosed lung cancers. In 2020, there were 2,206,771 (11.4%) new diagnoses of lung cancer, second only to breast cancer with 1.8 million deaths. Being asymptomatic at early stages leads to a late diagnosis resulting in the highest mortality rate [1].
Single target-based biomarkers for cancer have limitations as the disease involves multiple rather than an individual gene or protein [2]. Cancer cells employ alternative pathways to skip the single target or the target itself may get mutated [3,4]. Further, lack of tissue specificity renders them vulnerable to non-disease-specific increases, low accuracy, selectivity, specificity, and false diagnosis rates [5]. To overcome these limitations, a new concept of dynamic network biomarker (DNB) has emerged to identify the early-warning signals of diseases. DNB prediction is based on the study of the network of genes and their dynamic interactions at different time points or phases of a disease pointing to the critical signals of multiple chronic diseases or biological processes [6]. Many studies support an important role of DNB and their temporal interactions for early diagnosis and prognosis of cancer [7-10].
Considering the high mortality rate due to silent rapid progression of NSCLC, identification of a DNB which could reveal the tipping point of metastasis is highly important. This study aims to identify (i) lung tissue-specific genes that are differentially expressed in NSCLC; (ii) differentially expressed genes (DEG) specific to the different stages of NSCLC; (iii) the gene ontology-based semantic similarity genes; (iv) DNB that represents the NSCLC dynamic progression; and (vi) validation of DNB using in vitro expression studies in NSCLC cell lines.
2. MATERIALS AND METHODS
2.1. Search Strategy
In the first step, all relevant papers related to NSCLC were retrieved from electronic databases like PubMed [11], Embase [12], and Cochrane Database [13]. The queries were limited to meta-analysis, reviews, clinical trials, and English language articles published between January 1, 1987, and November 1, 2021.
2.2. Gene Retrieval from Literature-based Text Mining and Caner Databases
PMIDs of all articles were given as an input to Genie, a freely available web server for text mining [14]. All the relevant protein-coding genes were analyzed. To ensure only significant genes, the cutoff value as P < 0.01 for articles and false discovery rate <0.01 for genes were fixed. The genes were sorted according to their FDR. Two separate lists of significant genes were retrieved for NSCLC and SCLC. The NSCLC and SCLC-specific genes were also collected from different cancer databases: Cosmic [15], CANCER PORTAL, cBioPortal [16], IGDB NSCLC [17], disGeNET [18], GEPIA [19] using keywords “NSCLC genes” and “SCLC genes.” The significant genes specific to NSCLC and SCLC from the databases having P ≤ 0.01 were taken for further study. All duplicate genes were removed.
2.3. Identification of NSCLC-Specific DEGs
Genes that are differentially expressed in NSCLC were identified and visualized using the web tool Venn [20]. Genes were grouped as A and B, respectively, on the basis of gene retrieval sources; literature mining, and cancer databases. Genes only expressed in NSCLC were extracted taking intersection of NSCLC and SCLC in both the categories separately. Identification of SCLC genes was vital to find out DEGs of NSCLC as many genes are expressed in both; NSCLC and SCLC. Finally, the genes specific to NSCLC in Group A and Group B were subject to intersection to find out the common DEGs from both groups. Complete workflow of methodology is shown in Figure 1.
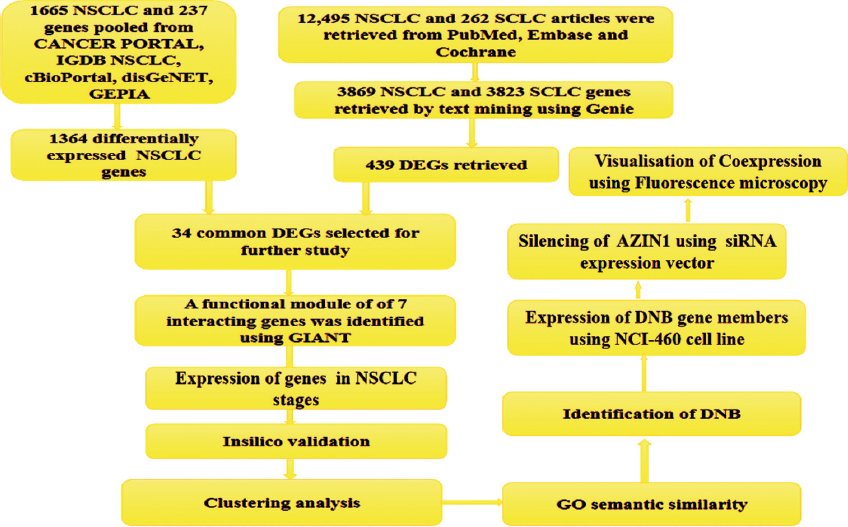 | Figure 1: Flowchart of methodology. [Click here to view] |
2.4. Tissue Specificity Analysis
Genome-wide Integrated Analysis of Gene Networks in Tissues (GIANT) server was used for functional pathway analysis and lung tissue specificity analysis [21]. To ensure the high lung tissue specificity, the expression level of each gene of interest was tested for their threshold P > 0.5 and S/N ratio >0.9. The functional pathway analysis was also carried out to know the dominant pathways of the significant genes.
2.5. Gene Expression Analysis
The identified genes of NSCLC were verified for their expression levels in the different NSCLC stages (IA, IB, IIA, IIB, IIIA, and IIIB). Human Microarray dataset (GI NO: GDS3837) specific to NSCLC stages was processed and normalized using array express [22]. The genes with log2 fold-change value >1.25 and P < 0.05 was selected for further analysis. The clustering analysis was carried out by the program ClustVis to identify the key regulating genes involved in all different stages of cancer [23].
2.6. Network Topological Analysis
The Gene Ontology (GO) based functional annotation was used to enhance the interpretation of our results. Navigo and BiNGO in Cytoscape [24] were used to find out the GO of selected genes and their biological properties-based network. Navigo is used to analyze the functional similarities and associations of GO terms and genes. The similarity of GO terms by a network was visualized at the “Network Visualization” page of Navigo and was imported in Cytoscape using the BiNGO plugin. BiNGO was used to categorize statistically over-represented GO of our genes of interest or subgraph of the biological network. The BiNGO was also used to study molecular interaction graphs.
2.7. DNB Construction Methods
To study the time-related changes in the gene expression during the metastasis; all the genes were classified into six stages (Stage1A, Stage1B, Stage2A, Stage2B, Stage3A, and Stage3B). Network topology of all the genes at different stages of NSCLC was analyzed in Cytoscape. Dynamic nature of the networks was based on the up and down-regulation of their genes in different stages of NSCLC.
The segmentation shift algorithm obtained the stage-specific active genes from the stage-specific expressions of all the six genes. It compares the fold change expression of each gene at each stage to its previous stage. The active genes were considered dynamic if they have more than one significant P-value whereas those with P < 0.5 were considered non-active. Once the dynamic active genes were identified they were mapped to stage-specific sub-networks.
2.8. Immune Infiltration Analysis
Tumor infiltrating cells are important for cancer prognosis and treatment. To find out the association of such cells with hub gene AZIN1 in our study, TIMER 2.0 database [http://timer.cistrome.org/] was used [25,26]. The results for the correlation between AZIN1 and tumor immune checkpoints PD-1, PD-L1, and CTLA4 were analyzed and considering statistically significant at P < 0.05. The Spearman correlation coefficient was used to calculate the correlation between AZIN1 expression and immune cells.
2.9. Gene Expression Analysis of DNB Genes in NCI-H460 Cell Lines
Immunofluorescence was used to study the gene expression of networking genes in NCI-H460 (Human lung epithelial large cell carcinoma) cells. The cell line was purchased from NCCS, Pune, India. The cells were maintained in RPMI-1640, supplemented with 10 % FBS, along with the 1% antibiotic-antimycotic solution. For the experiment, cells were cultured in a Nunc™ 96-Well Optical-Bottom Plate at a density of 2 × 10⁴ cells/0.2 mL and incubated overnight in a CO2 incubator at 37°C for 24 h. The cells were fixed and permeabilized with 2% Paraformaldehyde solution and incubated at RT for 20 min. Fixative was removed and the cells were washed with 1× phosphate-buffered saline (PBS). Staining of the cells with 10 ug/mL of desired antibodies (FITC conjugated mouse anti rabbit secondary antibody, Human HMGCR (C-1) FITC antibody (Cat No: SC-271595-FITC, Santa Cruz Biotechnology), Human EIF3H (E-10) PE antibody (Cat No: SC-271283-PE, Santa Cruz Biotechnology, USA, Human PGAM 1/4 (D-5) FITC antibody (Cat No: SC-365677-FITC, Santa Cruz Biotechnology, USA, Human DNT-1 (C-10) PE antibody (Cat No: SC-390041-PE, Santa Cruz Biotechnology, USA) was done followed by their incubation in dark for 30 mins. The cells were counter-stained with 1μg/ml of DAPI solution prepared in the 1× PBS and incubated for 15 min. Carl Zeiss LSM 880 Fluorescence Live cell imaging system (Confocal Microscope) with filter cubes of DAPI and FL1 (FITC) was used for observation. ZEN Blue image analyzer [27] and Image J (FIJI) Software were used for measuring the relative fluorescence intensity values [28].
2.10. Silencing of AZIN1 and Quantitative Analysis
siRNA target finder was used to design specific siRNAs targeting AZIN1 [29]. DNA sequences of the type AA (N19) were selected for design. Four candidate siRNAs targeting AZIN1 sequences were taken. Scrambled siRNA, having sequence 5’-AAACTCTTACGGTCACCAA-3’, was used as the negative control. NCI-H460 cells were transfected with pSILENCER 2.1-U6 plasmid vector using the Lipofectamine LTX and Plus transfection reagent (Life Technologies, Grand Island, NY). Total RNA was isolated from the transfected NCI-H460 cells and treated with RNase-free DNase I (Promega, Madison, WI). Reverse transcriptase-polymerase chain reaction (RT-PCR) was performed using primers specific for AZIN1, using forward primer 5’-TATGACTTTCGGCTTTGT-3’, reverse primer: 5’ -TCTGGTCCCAAATAGCTA-3’. Specific primers used for detecting expression of β-actin were: forward: 5’-GTGGGGCGCCCCAGGCACCA-3’ and reverse: 5’ -CTCCTTAATGTCA CGCACGATTTC-3’.
Transfected cells were treated with ice-cold PBS, and lysed in lysis buffer containing 1% Nonidet P-40, 250 mM NaCl, 50 mM Hepes (pH 7.4), 1 mM EDTA, and protease inhibitor. Proteins were separated by SDS-polyacrylamide gel electrophoresis and transferred onto a nitrocellulose membrane (Life Technologies, Gaithersburg, MD). Polyclonal anti-rabbit AZIN1 (1:1000, Dr. J. Mitchell) and polyclonal anti-goat actin (1:2000, Santa Cruz Biotechnology, Santa Cruz, CA) were used for detecting AZIN1 and β-actin, respectively. Proteins were visualized using the ECL-Plus enhanced chemiluminescence detection system (Santa Cruz Biotechnology) [30].
3. RESULTS
3.1. Identification of Differential Genes from Literature and Cancer Databases
Full-text articles published in PubMed, Embase, and Cochrane Database related to non-small cell lung cancer were searched for the past 35-year period (1987–2021). The selection criteria of these journals were meta-analysis, reviews, clinical trials, and English language articles. More genes were pooled from cancer databases. Genes that are differentially expressed in NSCLC were retrieved from two gene sets, where Set A was from the literature database and gene Set B was from the cancer database. Gene Set A comprising of 439 genes and Gene Set B with 1665 genes specific to NSCLC were analyzed. Overlap between Set A and Set B retrieved 34 common DEG in NSCLC [Figure 2].
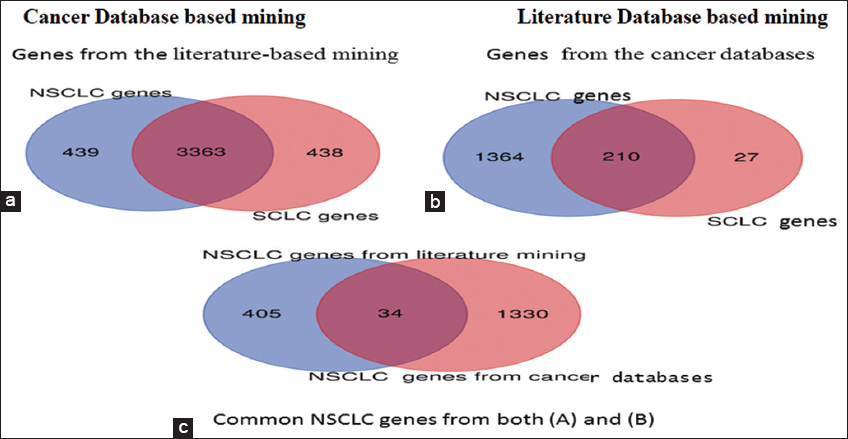 | Figure 2: Venn diagram showing the identification of NSCLC-specific DEGs from literature and cancer database [a] From the total 7692 (NSCLC and SCLC) literature-based genes, 439 were highly specific to NSCLC (b) From the total of 1902 cancer database-based genes, 1364 were highly specific to NSCLC (c) 34 NSCLC specific DEGs were common in literature and cancer database. [Click here to view] |
3.2. Tissue-specific Networks
Lung tissue-specific networks of the 34 DEGs were generated using GIANT. Three functional modules were identified. Further analysis of their expression in different tissues, pathways of interest, and genome-scale functional maps in human tissues revealed that the lung network of module 2 was functionally enriched with purine nucleotide, purine ribonucleoside monophosphate, and purine ribonucleoside triphosphate metabolic pathways [Figure 3a] It consisted of seven genes; AZIN1, CNOT9, HMGCR, EIF3H, PGAM1, DNTTIP1, and ST7. The GO-based functional annotation resulted in clustering of genes in two groups; purine metabolic process and drug metabolic process [Figure 3b].
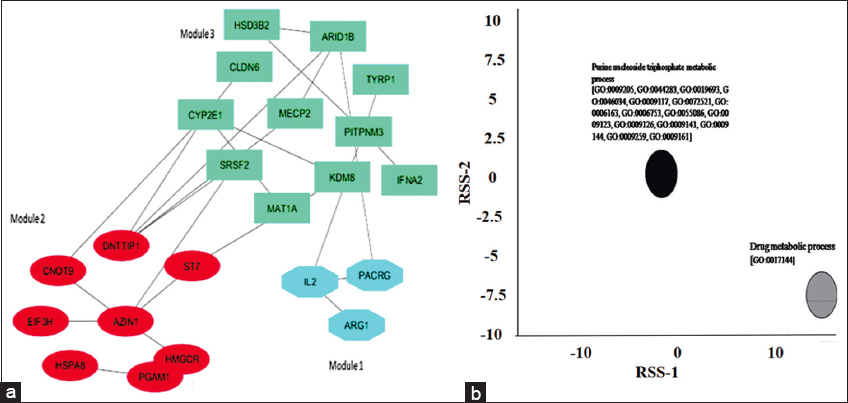 | Figure 3: (a) Identified functional module of 7 genes (module 2). (b) Gene Ontology-based functional annotation revealed two clusters of genes of module 2: purine metabolic process (black) and drug metabolic process (grey). [Click here to view] |
3.3. Clustering NSCLC Stage-specific Gene Expressions
The clustering analysis of seven DEGs at different NSCLC stages was done at two levels; stage-based clustering of genes and gene expression-based clustering [Figure 4]. Gene expression-based clustering showed similar expression patterns of PGAM1 and ST7 (cluster B1) while the other four genes formed the rest of the clusters with expressions of AZIN1 and DNTTIP1 being closest in cluster B2.
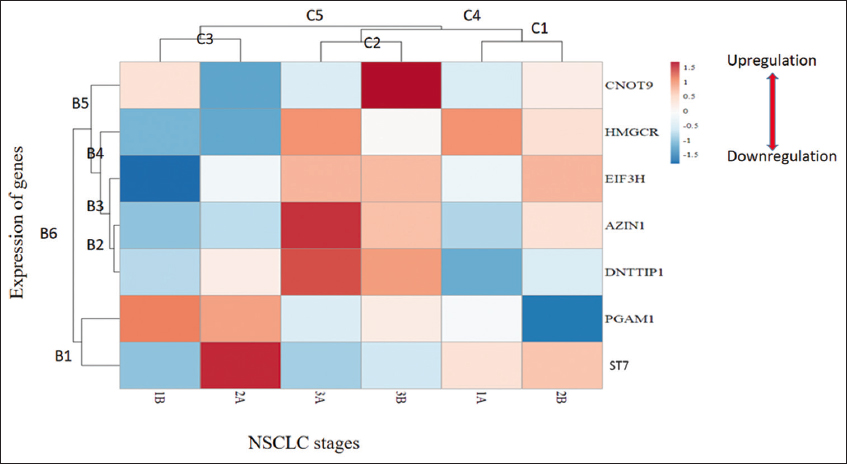 | Figure 4: Heatmap of genes using ClustVis.C1-C5 indicate different stage-specific clusters of expression patterns corresponding to down-regulation (C3), moderate expression with a certain variation (C1), and high expression (C2), respectively, whereas, clusters B1-B6 are gene expression based cluster. The color scale represents the fold change. [Click here to view] |
AZIN1 and ST7 showed drastic up-regulation as cancer progresses to higher stages (3A and 3B). It was further noted that significant changes were observed in all gene expressions at 2A and 2B transition stages; CNOT9, HMGCR, and EIF3H expression changes from low to high whereas ST7 and PGAM1 expression changes from high to low inferring stages 2A and 2B as tipping points for NSCLC metastasis. Genes AZIN1 and DNTTIP1 formed a close cluster B2 which pointed toward the role of DNTTIP1 in NSCLC metastasis.
3.4. DNBs
DNB analysis and gene expression of NSCLC-specific genes at six-time points indicated a critical stage before metastasis initiation at stage 2A [Figure 5]. To visually represent whether DNB is dynamic or not during the progression of NSCLC metastasis, we analyzed the shift in the weighted nodes of the seven members of the DNB based on their expression turnover; that is, a significant change in expression of genes before and after the tipping point of progression.
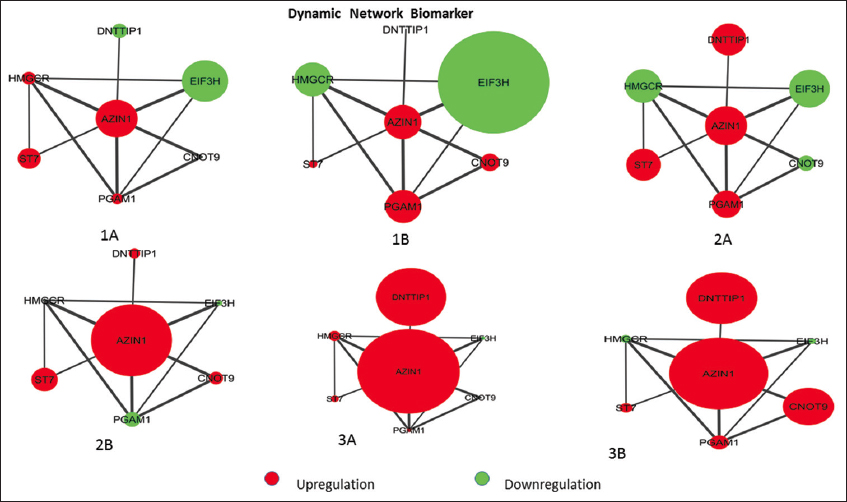 | Figure 5: The AZIN1-centric sub-network dynamic expression at various NSCLC stages 1A, 1B, 2A, 2B, 3A, and 3B. In the subnet red dot indicates the upregulation and green dot represents the downregulation. The node size represents the expression level in different stages. [Click here to view] |
We could identify expression turnover in AZIN1 and its six neighboring genes (PGAM1, CNOT9, HMGCR, EIF3H, DNTTIP1, and ST7) during the metastasis transition from 2A to 2B. Among the six genes, except for CNOT9 and PGAM1, the expression turnover of the four genes was up in the transition state from 2A to 2B. Genes CNOT9 and PGAM1 were down-regulated specifically at stages 2A and 2B, respectively. A visible shift in the expression of PGAM1 and CNOT9 in stage 2A and 2B of NSCLC demonstrate Stage 2A as a critical stage for NSCLC and PGAM1 and CNOT9 critical for segmentation shift in the progression of cancer.
3.5. Immune Infiltration Analysis
Correlation analysis of AZIN1 gene expression with three common immune checkpoints, PD-1, PD-L1, and CTLA-4 revealed that AZIN1 had a significant positive correlation with these three immune checkpoints [P < 0.05, Figure 6]. Significant correlation suggests that AZIN1 may inhibit immune functions by affecting the high expression of immune checkpoints.
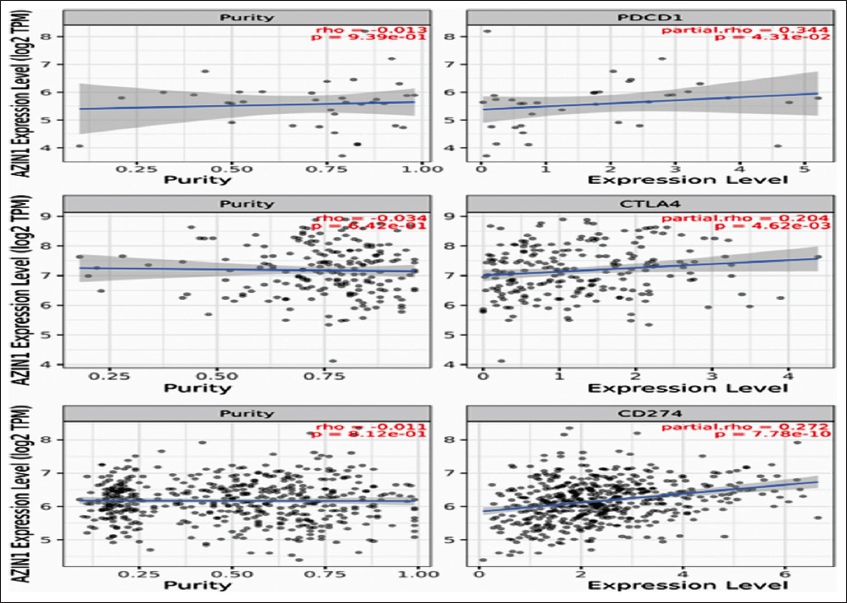 | Figure 6: TIMER 2.0 scatter plot showing Spearman correlation between the expression of AZIN1 and immune checkpoints of PD-1, PD-L1, and CTLA-4.Tumor purity (left) and filtration level (right). [Click here to view] |
3.6. AZIN1 Silencing Affects the DNB Co-expression
In addition to the individual expressions, coexpression of AZIN1, DNTTIP1, HMGCR, EIF3H, and PGAM1 were also observed in NCI-H460 using fluorescence microscopy and suitable stain conjugated antibodies [Figure 7].
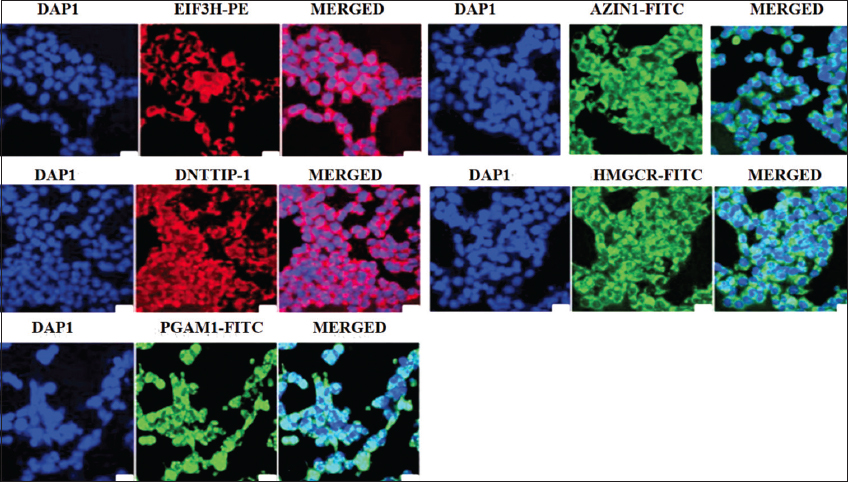 | Figure 7: Immunofluorescence staining of NCI-460 cells for localization and expression of AZIN1, DNTTIP1, EIF3H, HMGSC, and PGAM1. Green and red-immunosignal; blue-DAPI staining. All photomicrographs were taken at the same magnification. Scale bar: 100 µm. [Click here to view] |
Two AZIN1 siRNAs were transfected in NCI-H460 cells. Following transfection, cells transfected with AZIN1-siRNA1 and AZIN1-siRNA2, were analyzed using RT-PCR to see the reduction in transcription of AZIN1 mRNA. Scrambled siRNA failed to reduce the level of AZIN1 mRNA and AZIN1-siRNA1 silenced AZIN1 expression more than AZIN1-siRNA2 [Figure 8], therefore, further studies were performed using AZIN1-siRNA1 transfected cells.
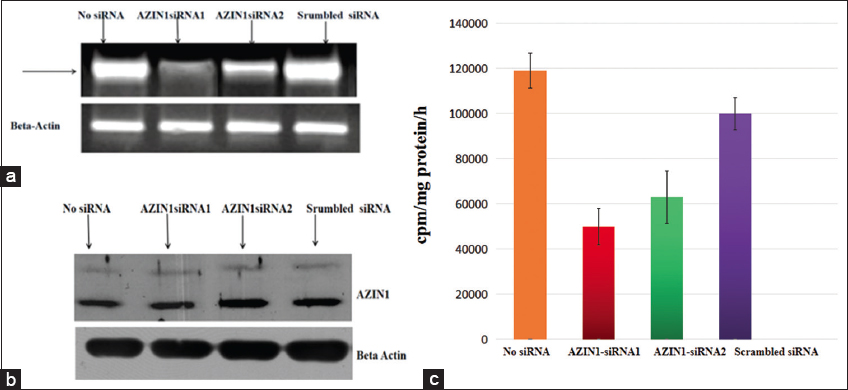 | Figure 8: (a) RT-PCR results of AZIN1 mRNA in AZIN1-siRNA-transfected NCI-460 cells. (b) Western blot analysis of AZIN1 protein. (c) AZIN1 expression graph. Data bars represent mean values ± SD (P < 0.05), n = 4. [Click here to view] |
Effect of silencing of AZIN1 gene on the expression of other network genes, DNTTIP1, HMGCR, EIF3H, and PGAM1 at 24 h was studied in AZIN1 siRNA1 silenced cells. The analysis revealed the difference in the expression of DNB members before and after the silencing of AZIN1 [Figure 9]. Suppressing the AZIN1 expression affected the expression of DNTTIP1, EIF3H, HMGCR, and PGAM1. EIF3H and HMGCR showed reduced expression whereas DNTTIP1 and PGAM1 were not expressed. Due to the unavailability of ST7 and CNOT9 antibodies, their expression could not be studied. In vitro expression studies of the interacting proteins confirm the role of AZIN1 as a hub gene of the identified DNB, therefore making it a suitable target for NSCLC.
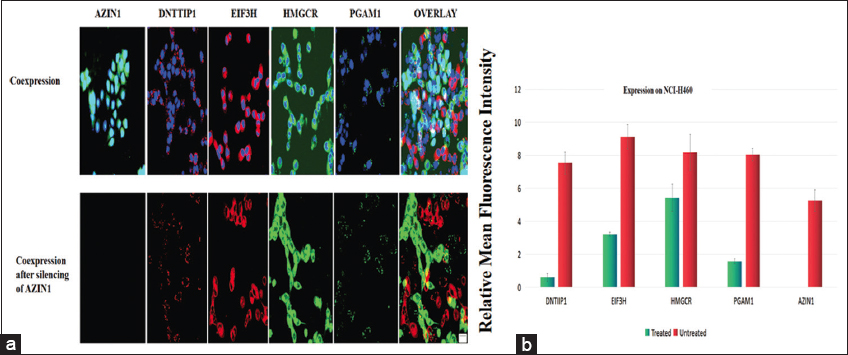 | Figure 9: (a) Immunofluorescence staining for localization and coexpression of AZIN1, DNTTIP1, EIF3H, HMGSC, and PGAM1. Upper panels: Untreated cells, Lower panel: cells transfected with specific siRNA for AZIN1 silencing. Green and red – immunosignal; blue-DAPI staining. All photomicrographs were taken at the same magnification. Scale bar: 100 µm. (b) Expression of DNB genes in AZIN1 siRNA transfected cells. Red bars represent the relative mean fluorescence intensity of untreated samples and blue bars represent that of treated samples. Data points or data bars represent mean values ± SD (P < 0.05), n=4. [Click here to view] |
4. DISCUSSION
Based on the importance of dynamic network genes, differential dynamic expression patterns, and functional pathways, the role of AZIN1 in initiation of NSCLC metastasis was inferred. Functional enrichment analysis pointed toward the involvement of a network of six genes (module 2) with all the genes having AZIN1 as their first interacting partner. Evidently, AZIN1 acts as a hub for module 2. On the basis of differential expression turnover rate, expression of AZIN1 was significantly higher compared to its interacting partners. AZIN1 has a significant functional role in various stages of NSCLC [31,32]. In accordance with our functional pathway analysis, AZIN1 is directly involved in cell proliferation through impairment of purine biosynthesis. Impaired purine metabolism is associated with the progression of cancer [33]. Overall, our analysis established that AZIN1 serves as a key regulator of the Module 2 [Figure 3a]. These results are in strong agreement with other studies in which AZIN1 is shown to play an important role in cancer progression through increasing ornithine decarboxylase activity to accelerate the formation of intracellular polyamine [34,35].
Metastasis is a complex process that involves dynamic interactions among multiple genes [36,37]. The previous studies indicated that DNBs play a key role in the initiation and development of many diseases by occupying an important position in regulatory pathways and modulating their outcomes [38-40]. To establish the connection of AZIN1 with NSCLC metastasis, AZIN1-centred network with its six neighboring genes was mapped and the nodes of this network were weighted according to the z-score transformed data of their real gene expression across the six stages [Figure 5]. The dynamic changes in AZIN1 and its neighboring genes were inferred from the series of analysis. The expression of AZIN1 and its six neighboring DEGs changed significantly from low to high or high to low at stage 2A.
In the AZIN1-centric network, in addition to AZIN1, each network partner plays crucial role in the NSCLC disease progression. HMGCR inhibits cell growth and induces apoptosis by deactivation of the Braf/MEK/ERK1/2 and Akt pathways and has a key role in NSCLC prevention [41]. EIF3H is also known to promote cell metastasis in NSCLC [42]. PGAM1 is shown to promote NSCLC cell growth, migration, and invasion [41]. To date, no reports regarding DNTTIP1 related to lung cancer research have been published. However, DNTTIP1 is a prognostic biomarker in hepatocellular carcinoma where it is shown to be involved in the deacetylation of p53 in regulating cell cycle and is associated with cancers at the molecular level [42].
It is known that OAZ1 has tumor-suppressor functions in polyamine-independent pathways which is neutralized by AZIN1 [43-46]. It is interesting that silencing the AZIN1 expression suppressed the expression of interacting DNB members. AZIN1 as a hub gene is an important finding in treating NSCLC progression. AZIN1 promotes cell proliferation and oncogenesis through polyamine-independent mechanisms by regulating Cyclin D1 (CCND1) levels [47-49]. PGAM1 expression has been studied in other cancers as well. It is upregulated in prostate cancer tissues and cell lines. Knockdown of PGAM1 by siRNA in a mouse xenograft model, inhibited cell proliferation, migration, and invasion and enhanced cancer cell apoptosis [50]. In our study, silencing of AZIN1 inhibits the expression of PGAM1. Reduced expression of PGAM1 results in decreased expression of Bcl-2 (B-cell lymphoma protein 2), enhanced expression of Bax (Bcl-2)-associated X), caspases-3, and inhibition of MMP-2 and MMP-9 expression. Bcl2 and Bax are cytoplasmic proteins, and act as a promoter and an inhibitor of apoptosis, respectively, and are prognostic markers in various cancers [51]. Silencing of AZIN1 also blocked the expression of DNTTIP1 in NSCLC l cell line. DNTTIP1is involved in the deacetylation of p53 in regulating cell cycle and is associated with cancers at the molecular level. DNTTIP1 has been found to be upregulated in hepatocellular carcinoma [52]. Very low suppression was seen in EIF3H and HMGCR. EIF3H interacts with PDCD4 enhancing lung adenocarcinoma cell metastasis [53]. HMGCR also has role in liver cancer [54] and breast cancers [55]. Our study renders the evidence that the predicted DNB can be used as an effective prognostic biomarker for NSCLC.
5. CONCLUSION
Our study provides insights into the molecular mechanism of lung cancer by identification of AZIN1-based network of six genes which interact dynamically and can be used as biomarker for the tipping point of NSCLC metastasis. The notion of a tipping point in cancer studies helps to devise more accurate strategies to select appropriate treatments for cancer patients as well as has major implications for future biomarker research.
6. AUTHORS’ CONTRIBUTIONS
All authors made substantial contributions to the conception and design, acquisition of data, or analysis and interpretation of data; took part in drafting the article or revising it critically for important intellectual content; agreed to submit to the current journal; gave final approval of the version to be published; and agreed to be accountable for all aspects of the work. All the authors are eligible to be an author as per the International Committee of Medical Journal Editors (ICMJE) requirements/guidelines.
7. FUNDING
The research is supported by IGNOU research fellowship to AC.
8. CONFLICTS OF INTEREST
The authors report no financial or any other conflicts of interest in this work.
9. ETHICAL APPROVALS
This study does not involve experiments on animals or human subjects.
10. DATA AVAILABILITY
All the data obtained in the study are represented as figures.
11. PUBLISHER’S NOTE
This journal remains neutral with regard to jurisdictional claims in published institutional affiliation.
REFERENCES
1. Cancer Today. Available from:https://gco.iarc.fr/today/home [Last accessed on 2023 Sep 23].
2. Siegel RL, Miller KD, Jemal A. Cancer statistics, 2019. CA Cancer J Clin 2019;69:7-34. [CrossRef]
3. Wang X, Ward P. Opportunities and challenges of disease biomarkers:A new section in the journal of translational medicine. J Transl Med 2012;10:240. [CrossRef]
4. Hoang PH, Landi MT. DNA methylation in lung cancer:Mechanisms and associations with histological subtypes, molecular alterations, and major epidemiological factors. Cancers (Basel) 2022;14:961. [CrossRef]
5. Al-Joufi FA, Setia A, Salem-Bekhit MM, Sahu RK, Alqahtani FY, Widyowati R, et al. Molecular pathogenesis of colorectal cancer with an emphasis on recent advances in biomarkers, as well as nanotechnology-based diagnostic and therapeutic approaches. Nanomaterials (Basel) 2022;12:169. [CrossRef]
6. Jiang F, Yang L, Jiao X. Dynamic network biomarker to determine the critical point of breast cancer stage progression. Breast Cancer 2023;30:453-65. [CrossRef]
7. Restrepo JC, Dueñas D, Corredor Z, Liscano Y. Advances in genomic data and biomarkers:Revolutionizing NSCLC diagnosis and treatment. Cancers (Basel) 2023;15:3474. [CrossRef]
8. Aihara K, Liu R, Koizumi K, Liu X, Chen L. Dynamical network biomarkers:Theory and applications. Gene 2022;808:145997. [CrossRef]
9. Chen S, Li D, Yu D, Li M, Ye L, Jiang Y, et al. Determination of tipping point in course of PM(2.5) organic extracts-induced malignant transformation by dynamic network biomarkers. J Hazard Mater 2022;426:128089. [CrossRef]
10. Liu R, Wang X, Aihara K, Chen L. Early diagnosis of complex diseases by molecular biomarkers, network biomarkers, and dynamical network biomarkers. Med Res Rev 2014;34:455-78. [CrossRef]
11. Wu L, Qu X. Cancer biomarker detection:Recent achievements and challenges. Chem Soc Rev 2015;44:2963-97. [CrossRef]
12. Website Information PubMed;2021. Available from:https://www.ncbi.nlm.nih.gov/pubmed [Last accessed on 2020 Apr 27].
13. Website Information Embase;2021. Available from:https://www.embase.com [Last accessed on 2020 Apr 27].
14. Website Information Cochrane;2021. Available from:https://www.cochrane.org [Last accessed on 2020 Apr 27].
15. Moores DW, Miller SJ Jr., McKneally MF. Lung cancer:A surgeon's approach. Curr Probl Surg 1987;24:679-758. [CrossRef]
16. Website Information Data Mining Tools. Génie;2020. Available from:https://cbdm-01.zdv.uni-mainz.de/~jfontain/cms/?page_id=6 [Last accessed on 2020 Jun 14].
17. Website Information COSMIC-Catalogue of Somatic Mutations in Cancer;2020. Available from: https://cancer.sanger.ac.uk/cosmic [Last accessed on 2020 Aug 20].
18. Website Information cBioPortal for Cancer Genomics;2020. Available from:https://www.cbioportal.org [Last accessed on 2020 Apr 22].
19. Website Information IGDB.NSCLC;2020. Available from:https://igdb.nsclc.ibms.sinica.edu.tw [Last accessed on 2020 Aug 22].
20. Website Information DisGeNET - a Database of Gene-Disease Associations;2020. Available from:https://disgenet.org [Last accessed on 2020 Aug 26].
21. Website Information GEPIA (Gene Expression Profiling Interactive Analysis). Available from:https://gepia.cancer-pku.cn [Last accessed on 2020 Aug 26].
22. Sterck L. Draw Venn Diagram;2021. Available from:https://bioinformatics.psb.ugent.be/webtools/venn [Last accessed on 2020 Aug 21].
23. Website Information GIANT:Genome-scale Integrated Analysis of Gene Networks in Tissues. Available from: https://giant.princeton.edu [Last accessed on 2021 Apr 20].
24. Website Information Embl-Ebi;n.d. ArrayExpress. Available from:https://www.ebi.ac.uk/arrayexpress [Last accessed on 2021 Apr 29].
25. Zeng Q, Michael IP, Zhang P, Saghafinia S, Knott G, Jiao W, et al. Synaptic proximity enables NMDAR signalling to promote brain metastasis. Nature 2019;573:526-31. [CrossRef]
26. Li T, Fu J, Zeng Z, Cohen D, Li J, Chen Q, et al. TIMER2.0 for analysis of tumor-infiltrating immune cells. Nucleic Acids Res 2020;48:W509-14. [CrossRef]
27. Metsalu T, Vilo J. ClustVis:A web tool for visualizing clustering of multivariate data using principal component analysis and heatmap. Nucleic Acids Res 2015;43:W566-70. [CrossRef]
28. Website Information Cytoscape;2022. Available from:https://cytoscape.org [Last accessed on 2022 Dec 16].
29. Zen Blue - Exploring the Image Analysis Module - Harvard University. Available from:https://hcbi.fas.harvard.edu/files/image_analysis_guide_revised_01-2014.pdf [Last accessed on 2023 Aug 05].
30. Morales García MD. Fiji Software user Manual. Spain:Universidad Autónoma de Madrid;2022. [CrossRef]
31. Bioz.com (no date) BIOZ Ratings for Life-Science Research, Bioz. Available from:https://www.bioz.com/result/sirna%20ambion%20target%20finder%20software/product/Thermo%20Fisher [Last accessed on 2023 Aug 05].
32. Electrogenerated Chemiluminescence (ECL). The IUPAC Compendium of Chemical Terminology. United States:CRC Press;2014.
33. Hu X, Chen J, Shi X, Feng F, Lau KW, Chen Y, et al. RNA editing of AZIN1 induces the malignant progression of non-small-cell lung cancers. Tumour Biol 2017;39:101042831770000. [CrossRef]
34. Cai Y, Wu Q, Liu Y, Wang J. AZIN1-AS1, a novel oncogenic LncRNA, promotes the progression of non-small cell lung cancer by regulating MiR-513b-5p and DUSP11. Onco Targets Ther 2020;13:9667-78. [CrossRef]
35. Lambertos A, Nuñez-Sanchez MA, López-García C, López-Contreras AJ, Ramos-Molina B, Peñafiel R. Antizyme inhibitor 2-deficient mice exhibit altered brain polyamine levels and reduced locomotor activity. Biomolecules 2022;13:14. [CrossRef]
36. Lian J, Liang Y, Zhang H, Lan M, Ye Z, Lin B, et al. The role of polyamine metabolism in remodeling immune responses and blocking therapy within the tumor immune microenvironment. Front Immunol 2022;13:912279. [CrossRef]
37. Poste G, Fidler IJ. The pathogenesis of cancer metastasis. Nature 1980;283:139-46. [CrossRef]
38. Shomar A, Barak O, Brenner N. Cancer progression as a learning process. iScience 2022;25:103924. [CrossRef]
39. Deb S, Bhandary S, Sinha SK, Jolly MK, Dutta PS. Identifying critical transitions in complex diseases. J Biosci 2022;47:25. [CrossRef]
40. Li M, Zeng T, Liu R, Chen L. Detecting tissue-specific early warning signals for complex diseases based on dynamical network biomarkers:Study of type 2 diabetes by cross-tissue analysis. Brief Bioinform 2013;15:229-43. [CrossRef]
41. Li M, Li C, Liu WX, Liu C, Cui J, Li Q, et al. Dysfunction of PLA2G6 and CYP2C44-associated network signals imminent carcinogenesis from chronic inflammation to hepatocellular carcinoma. J Mol Cell Biol 2017;9:489-503. [CrossRef]
42. Zhang T, Bai R, Wang Q, Wang K, Li X, Liu K, et al. Fluvastatin inhibits HMG-CoA reductase and prevents non-small cell lung carcinogenesis. Cancer Prev Res (Phila) 2019;12:837-48. [CrossRef]
43. Hu Y, Wei X, Lv Y, Xie X, Yang L, He J, et al. EIF3H interacts with PDCD4 enhancing lung adenocarcinoma cell metastasis. Am J Cancer Res 2020;10:179-95.
44. Wu Y, Chen S, Wen P, Wu M, Wu Y, Mai M, et al. PGAM1 deficiency ameliorates myocardial infarction remodeling by targeting TGF-βvia the suppression of inflammation, apoptosis and fibrosis. Biochem Biophys Res Commun 2021;534:933-40. [CrossRef]
45. Zhu C, Tong R, Jiang X, Xiao H, Guan J, Shu J. DNTTIP1 is a prognostic biomarker correlated with immune infiltrates in hepatocellular carcinoma:A study based on the cancer genome atlas data. Front Genet 2022;12:767834. [CrossRef]
46. Fong LY, Feith DJ, Pegg AE. Antizyme overexpression in transgenic mice reduces cell proliferation, increases apoptosis, and reduces N-nitrosomethylbenzylamine-induced forestomach carcinogenesis. Cancer Res 2003;63:3945-54.
47. Olsen RR, Zetter BR. Evidence of a role for antizyme and antizyme inhibitor as regulators of human cancer. Mol Cancer Res 2011;9:1285-93. [CrossRef]
48. Casimiro MC, Velasco-Velázquez M, Aguirre-Alvarado C, Pestell RG. Overview of cyclins D1 function in cancer and the CDK inhibitor landscape:Past and present. Expert Opin Investig Drugs 2014;23:295-304. [CrossRef]
49. Finn RS, Aleshin A, Slamon DJ. Targeting the cyclin-dependent kinases (CDK) 4/6 in estrogen receptor-positive breast cancers. Breast Cancer Res 2016;18:17. [CrossRef]
50. Wen YA, Zhou BW, Lv DJ, Shu FP, Song XL, Huang B, et al. Phosphoglycerate mutase 1 knockdown inhibits prostate cancer cell growth, migration, and invasion. Asian J Androl 2018;20:178-83. [CrossRef]
51. Kaloni D, Diepstraten ST, Strasser A, Kelly GL. Bcl-2 protein family:Attractive targets for cancer therapy. Apoptosis 2022;28:20-38. [CrossRef]
52. Budhu A, Forgues M, Ye, QH, Jia HL, He P, Zanetti KA, et al. Prediction of venous metastases, recurrence, and prognosis in hepatocellular carcinoma based on a unique immune response signature of the liver microenvironment. Cancer Cell 2006;10:99-111. [CrossRef]
53. Jiang SL, Mo JL, Peng J, Lei L, Yin JY, Zhou HH, et al. Targeting translation regulators improves cancer therapy. Genomics 2021;113:1247-56. [CrossRef]
54. Wei Y, Chen W, Li Z, Xie K, Liu F. EIF3H stabilizes ccnd1 to promotes intrahepatic cholangiocarcinoma progression via Wnt/β-catenin signalling. FASEB J 2022;36:e22647. [CrossRef]
55. Roy S, Gupta D. Analysis of breast cancer next-generation sequencing datasets for identifying fusion genes responsible for the cancer progression. Inform Med Unlocked 2023;41:101306. [CrossRef]