
1. INTRODUCTION
Matoa (Pometia pinnata, J. R. Forst. and G. Forst.) is a plant of the sapindaceae group found and distributed throughout Indonesia [1]. Matoa plants can grow in all conditions between subtropical and tropical regions with averages of annual rainfall from 1500 to 5000 mm and all types of soils at 4–8 pH [2]. Matoa was used for consumption, whereas the leaves were used as antibacterials and antioxidants [3]. Based on the advantages of matoa, the Decree of the Minister of Agriculture of the Republic of Indonesia No.160/Kpts/SR.120/3/2006 has determined matoa as a superior fruit that has been cultivated.
Matoa fruit has an ellipsoid shape and yellow-white flesh 158 B). Based on the pericarp, matoa fruit has red, yellow, and green colors [4-6]. The pericarp color was affected by environment, genetics and interaction. On the other hand, apart from the color of the pericarp, matoa has the same morphology for each variety. Derived from the previous study, the varieties that were considered different were not truly known; therefore, the identification of genetic information about matoa fruit remains to be seen. Genetic information aims to overcome the limitations of morphological identification, where the genetic information in the DNA of an organism is not affected by the environment [6]. In a previous study, the genetic information of matoa was identified by the RAPD marker [7]. To complete the genetic information of matoa, DNA barcodes were used. The result of a DNA barcoding experiment was a DNA sequence. DNA sequences are the fundamental blueprint of life, dictating the structure and function of living organisms and ensuring the continuity of life through generations. DNA sequencing plays a crucial role in supporting plant breeding by providing valuable genetic information that helps breeders understand the genetic makeup of plants and identify desirable traits for selection.
DNA barcoding was used for identifying species, diagnosing species based on all stages of the life history of living organisms, testing the consistency of species with reference to variability, and marking new species [8]. Through the DNA barcoding of individuals in a breeding, genomic selection models can be built to predict the performance of untested individuals based on their genetic makeup [9]. This helps breeders select plants with the best potential for desired traits without having to physically test them. According to the recommendations of the consortium for the barcode of life, DNA barcoding analysis can be performed by isolating and amplifying chloroplast genomic genes with rbcl and matK [10]. In the amplification process, the matK gene was more difficult to amplify compared to the rcbl gene, whereas it can provide higher resolution for species comparison and relative diversity within a species [11]. The analysis of the diversity was performed using the matK gene, while the DNA amplification was performed by polymerase chain reaction (PCR) using matK primer sets. The product of matK amplification was usually short, at around 600–800 base pairs (bp) and up to 1500 bp [12]. The aim of this study was to determine the variation of DNA sequences and matK gene similarity.
2. MATERIALS AND METHODS
2.1. Sample Collection
The sample used in the study was leaves from matoa that were found in central Java, Indonesia. Five variety were found and analyzed: green matoa that has a full green color (coded M1), red matoa that has a red color with a hint of yellow and green (coded M2), yellow matoa that has a full yellow or yellow color with a slight green tint (coded M3), brown matoa that has a full brown color (coded M4), and purple matoa that has a full purple color or with a slight yellow-red tint (coded M5) [Figure 1]. The sample was from mature leaves of matoa to ensure that the leaves were healthy and free from diseases or pests. The leaf sample was cleaned with alcoholic tissue, wrapped in plastic with silica gel, and brought into the laboratory of Biotechnology Research Indonesia-The Netherlands (Biorin).
 | Figure 1: Matoa (M1: Green matoa; M2: Red matoa; M3: Yellow matoa; M4: Brown matoa; M5: Purple matoa). [Click here to view] |
2.2. DNA Isolation, DNA Amplification by PCR, and DNA Sequencing
DNA isolation was extracted from 100 mg of plant spesies and carried out with the genomic DNA mini kit for plants using Geneaid protocols. The genomic DNA mini kit (plant) protocol, then the genomic DNA obtained can be stored at −20°C. The DNA quantification was performed on a 1% agarose gel by electrophoresis.
DNA amplification was performed by PCR using matK-barP-390F 5’ CGATCTATTCATTCAATATTTC 3’ as the forward primer and matK-barP-1326R 5’ TCTAGCACACGAA AGTCGAAGT 3’ as the reserve primer [13,14] with a concentration of 10 pmol/μL. The results of PCR amplification with matK primer were seen using gel electrophoresis; the resulting PCR results measured 750 bp. The PCR products were carried out by sequencing nucleotides at PT. Genetika Science, a company that provided sequencing services.
2.3. Data Analysis
The result of the sequencing was an acid-base sequence of nucleotides. The sequencing was combined with primer reverse sequence and primer forward sequence results. The sequence results were aligned with the closest relatives to determine the species using the basic local alignment search tool available at the National Center for Biology Information (NCBI) [15]. The analysis of the phylogenetic tree was performed by the maximum likelihood (ML) method with Kimura 2-parameters and maximum parsimony (MP) with bootstrapping 1000× replicates using the molecular evolutionary genetics analysis version 11 software application [16].
3. RESULTS
3.1. PCR Result of DNA Quality and Amplification
The DNA quality and amplification were analyzed by electrophoresis in an agarose gel and visualized under UV light [Figure 2].
 | Figure 2: (a) DNA quantification of matoa visualized by electrophoresis. (b) Visualization of matK gene polymerase chain reaction products. [Click here to view] |
The amount of DNA quality in each band was estimated by comparison with known standard DNA concentrations. Based on the visualization of DNA quantification, the 1st ladder was 10 ng/µl, the 2nd ladder was 30 ng/µl, and the 3rd ladder was 50 ng/µl. Whereas, the 4–8th ladder was the matoa DNA. The DNA quality of the observed matoa did not have a big difference compared to the existing DNA standard; this indicated that the quality and concentration of matoa DNA were high because they produced clear DNA bands.
Based on the result, the primer sets of 390F and 1326R indicate that they were able to amplify respective regions and gave a sharp band on Agarose gel electrophoresis with a length of 750–1500 bp according to the matK gene. The results of DNA amplification were then sequenced to determine the nucleotide base sequence for each type of matoa.
3.2. DNA Sequence Analysis
The result of DNA sequencing was a sequence of nucleotides performed by the chain termination method developed by Sanger (1977) [17] that was compared with the closest relatives to determine the species using BLAST analysis based on NCBI [18]. Based on the blast analysis, the nucleotide sequence of all five matoa was closest subject to the species of Pometia tomentosa with accession number AF314802 version number 1 [Table 1]. In this study, the matoa were observed in length from 905 bp to 1286 bp, with identity similarity ranging from 98.08% to 99.44%. The parameters used to determine the similarity of these species were the E-value and Max Score in alignment [Figure 3].
Table 1: BLAST analysis of matoa DNA sequence based on CNBI.
| Code | Accession | Lenght of bp | % identity |
|---|---|---|---|
| M1 | P. tomentosa AF314802.1 | 905 bp | 98.08 |
| M2 | P. tomentosa AF314802.1 | 1286 bp | 99.44 |
| M3 | P. tomentosa AF314802.1 | 1279 bp | 99.02 |
| M4 | P. tomentosa AF314802.1 | 1280 bp | 99.30 |
| M5 | P. tomentosa AF314802.1 | 1264 bp | 99.15 |
P. tomentosa: Pometia tomentosa, bp: Basepair.
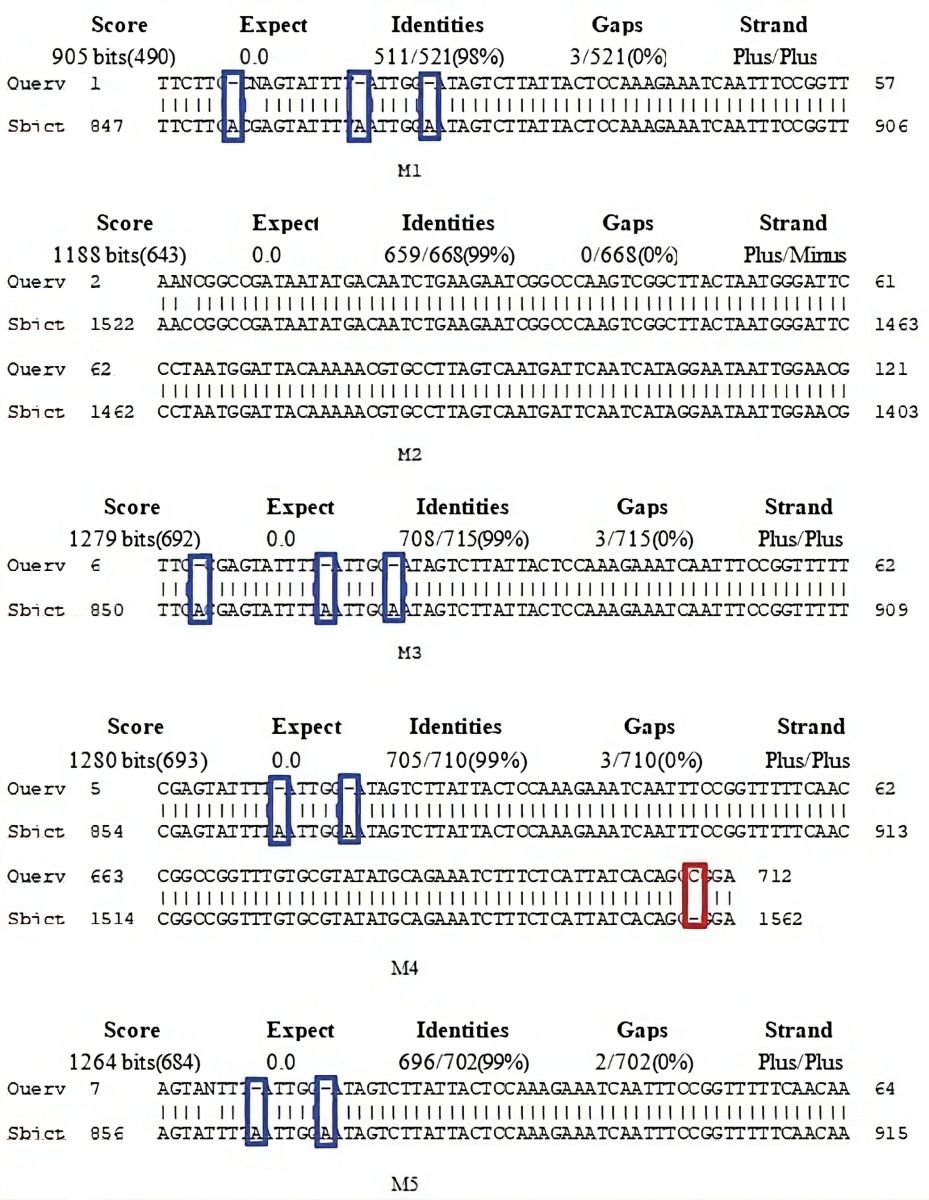 | Figure 3: Alignment of matoa DNA sequence based on NCBI. [Click here to view] |
The alignment based on NCBI was to show the score, identities, and gaps between the query and the subject. In this study, the query was all five nucleotide sequences of matoa, while the subject was P. tomentosa AF314802.1.
The alignment was associated with mutation processes, and the gaps were associated with deletion (the blue boxes) or insertion (the red boxes) processes [Figure 3]. In the green matoa (M1) and yellow matoa (M3), there were 3 gaps in the same nucleotide sequence, which were caused by a deletion in the query, whereas in the red matoa (M2), there were no gaps between the query and the subject, so they have the highest percent identities (99.44%). The brown matoa (M4) has 3 gaps due to deletions and insertions, while the purple matoa (M5) has 2 gaps in the query.
The calculation of genetic distance was to determine the index disimilarity between the types of matoa observed. The pairwise genetic distance of all the five matoa observed has been listed [Table 2]. The overall distance ranged from the lowest 0.000 to the highest 0.0046 between yellow matoa (M3) and purple matoa (M5). These results show that the relationship between the five that matoa were observed was very close; the smallest distance between the saples that were observed was neighbors, which shows that the pair has a very close relationship.
Table 2: Genetic distance matrix table of matoa.
| Nomor aksesi | Spesies | 1 | 2 | 3 | 4 | 5 |
|---|---|---|---|---|---|---|
| AF314802.1 (M1) | P. tomentosa | |||||
| AF314802.1 (M2) | P. tomentosa | 0.0000 | ||||
| AF314802.1 (M3) | P. tomentosa | 0.0000 | 0.0015 | |||
| AF314802.1 (M4) | P. tomentosa | 0.0000 | 00000 | 0.0015 | ||
| AF314802.1 (M5) | P. tomentosa | 0.0022 | 0.0030 | 0.0046 | 0.0030 |
P. tomentosa: Pometia tomentosa.
3.3. Phylogenetic Tree Analysis
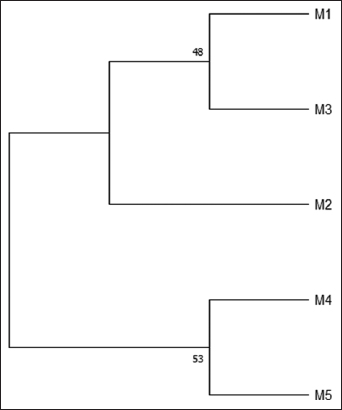
No outgroup was used for the phylogenetic construction because the purpose of this study was to find the nearly identical matoa that were observed. Based on the phylogenetic construction, the matoa were observed to consist of two groups. The phylogenetic analysis has indicated that the red matoa (M2) is closely related to the green matoa (M1) and yellow matoa (M3), though they are separated in different clusters. The brown matoa (M4) and purple matoa (M5) were very close because they belonged to the same cluster.
4. DISCUSSION
The result of the analyses of the matK gene showed that all matoa samples were from the same spesies that is P. tomentosa, with an identity value of 98.08%–99.44%. Based on BLAST analysis based on NCBI [Table 1], the red matoa (M2) has a higher equation of 99.40%, while the green matoa (M1) has a lower equation of 98.08%. According to plants of the World online, P. pinnata J. R. Forst. and G. Forst. have 40 synonyms, with 5 homotypic synonyms and 35 heterotypic synonyms [1,19]. P. tomentosa AF314802 is a group of P. tomentosa (Blume) Teijsm. and Binn, which is a heterotypic synonym of P. pinnata Forst. and Forst. that was first discovered in 2001 [20].
Green matoa (M1) have a shorter bp length of 905 bp than other types of matoa, which have a length of >1000 bp. The different bp lengths of all matoa were observed to be the same species, although they have different genetic variations, such as small deletions or insertions in chromosomes, that do not result in significant differences [21,22]. Based on the previous research, the average length of bp in red, yellow, green, and black matoa is 200–1500 bp with analysis based on RAPD, while the data on the genbank for P. tomentosa has a complete sequence of 1846 bp with analysis based on matK [7]. P. tomentosa has a complete plastid genome, which has a circular DNA molecule with a length of 160,818 bp [23]. The small deletions or insertions on the alignment DNA sequence analysis showed the characteristics of matoa types were observed. Recently, the ML was used to analyze the DNA sequence to confirm the matoa type that is closely related [24]. The phylogenetic tree showed the sample was divided into 2 clusters [Figures 4 and 5], with the closest relationship between the green matoa (M1), yellow matoa (M3), and red matoa (M2) that clustered together. The brown matoa (M4) and the purple matoa (M5) were in the same cluster. This clustering was grouping based on the pericarp color. Matoa with yellow and green colors were included in the same cluster, while brown and purple matoa were included in different groups. This can be used as a prediction that genes also influence the anthocyanin composition of the pericarp color. The node value of the ML phylogenetic tree was lowest than 70; the nodes will support when the value is at the ≥70 bootstrap support level [25]. In this study, phylogenetic reconstruction using the PM method had a strong supported bootstrap (≥70), which was estimated to be true for the analysis of P. pinnata at the matK gene.
 | Figure 4: Matoa phylogenetic trees using maximum likelihood (% over 1000 replicates). [Click here to view] |
 | Figure 5: Matoa phylogenetic trees using PM (% over 1000 replicates). [Click here to view] |
The genetic distance of all matoa observed (0.000–0.0046) was found to be low, inferring that they were closely related and descendants of a near-common ancestor. The previous study showed that the yellow matoa, green matoa, and red matoa found in Central Java, Indonesia, have the same karyotype formula and are grouped into the same species [5]. Based on the result of the matK gene, there is potentially for analysis of the DNA sequence and phylogenetic studies in matoa that can validate matoa kinship based on the color of the pericarp.
5. CONCLUSION
The results of matK gene analysis showed the sample used was P. tomentosa AF314802.1, with a similarity value of 98.08%–99.40%. The analysis of phylogenetic trees using the ML method shows that all species of matoa were divided into two clusters and showed that the yellow matoa and green matoa were closely related, while the red matoa were not clustered together, whereas the brown matoa and purple matoa were in the same cluster. Based on the results of the analysis, matK gene barcoding can be used for molecular analysis of matoa. This data can be used for further research to determine the association of the DNA nucleotide based on matK with the exocarp color genes of matoa. More detailed research and genetic analysis would be needed to confirm and understand the specific genetic variations responsible for the differences in exocarp color in matoa fruit.
6. ACKNOWLEDGMENT
The authors are grateful to directorate general of the higher education, research, and technology,
7. AUTHORS’ CONTRIBUTIONS
All authors made substantial contributions to conception and design, acquisition of data, or analysis and interpretation of data; took part in drafting the article or revising it critically for important intellectual content; agreed to submit to the current journal; gave final approval of the version to be published; and agreed to be accountable for all aspects of the work. All the authors are eligible to be an author as per the International Committee of Medical Journal Editors (ICMJE) requirements/guidelines.
8. FUNDING
This research was funded by the Directorate General of the Higher Education, Research, and Technology, KEMENDIKBUD RI with number 380.1/UN27.22/PT.01.03/2023.
9. CONFLICTS OF INTEREST
The authors report no financial or any other conflicts of interest in this work.
10. ETHICAL APPROVALS
This research did not involve experiments on animals or human subjects.
11. DATA AVAILABILITY
All the data is available with the authors and shall be provided upon request.
12. PUBLISHER’S NOTE
This journal remains neutral with regard to jurisdictional claims in published institutional affiliation.
REFERENCES
1. POWO. Pometia pinnata J. R. Forst. and G. Forst. Available from:https://powo.science.kew.org/taxon/urn:lsid:ipni.org:names:784485-1 [Last accessed on 2023 Aug 23].
2. Lim TK. Pometia pinnata. In:Edible Medicinal and Non-medicinal Plants, Fruits. Vol. 6. Dordrecht:Springer;2013. 92-6. [CrossRef]
3. Triana A, Maruddin F, Malaka R. Supplementation of matoa (Pometia pinnata) leaf extract and alginate suppressed the growth of Staphylococcus aureus and Escherichia coli in pasteurized milk. IOP Conf Ser Earth Environ Sci 2020;492:012044. [CrossRef]
4. Nasution F, Hadiati S. The diverse collection of exotic tropical fruits in the Indonesian tropical fruit research institute (ITFRI). J Trop Hortic 2020;3:75-9. [CrossRef]
5. Yuniastuti E, Masailla AP, Nandariyah N, Rahmah N. Karyotyping of green, yellow and red matoa (Pometia pinnata J. R. Forst. and G. Forst.) from Central Java, Indonesia. Biodiversitas 2023;24:40-6. [CrossRef]
6. Dar AA, Mahajan R, Sharma S. Molecular markers for characterization and conservation of plant genetic resources. Indian J Agric Sci 2019;89:1755-63. [CrossRef]
7. Zulfahmi Z, Pertiwi SA, Rosmaina R, Elfianis R, Gulnar Z, Zhaxybay T, et al. Molecular identification of mother trees of four matoa cultivars (Pometia pinnata Forst and Forst) from Pekanbaru city, Indonesia using RAPD markers. Biodiversitas 2023;24:1524-30. [CrossRef]
8. Shneyer VS, Rodionov AV. Plant DNA barcodes. Biol Bull Rev 2019;9:295-300. [CrossRef]
9. Yu X, Li X, Guo T, Zhu, Wu Y, Mitchell SE, et al. Genomic prediction contributing to a promising global strategy to turbocharge gene banks. Nat Plants 2016;2:16150. [CrossRef]
10. CBOL Plant Working Group. A DNA barcode for land plants. Proc Natl Acad Sci U S A 2009;106:12794-7. [CrossRef]
11. Arif MF, Aristya GR, Subositi D, Sari AN, Kasiamdari RS. Short communication:RbcL and matK chloroplast DNA composition of green chireta (Andrographis paniculata) from Indonesia. Biodiversitas 2019;20:3575-83. [CrossRef]
12. Selvaraj D, Sarma RK, Sathishkumar R. Phylogenetic analysis of chloroplast matK gene from Zingiberaceae for plant DNA barcoding. Bioinformation 2008;3:24-7. [CrossRef]
13. Milliken W, Odonne G, Engel J, Tourneau FM, Suescun U, Chave J. Fast and novel botanical exploration of a 320-km transect in Eastern Amazonia using DNA barcoding. Acta Amazonica 2022;52:29-37. [CrossRef]
14. Szlachetko DL, Gorniak M, Kolanowska M, Mytnik-Ejsmont J, Kowalkowska AK, Rutkowski P, et al. Taxonomic position and phylogeny of the genus Vargasiella (Orchidaceae, vandoideae) based on molecular and morphological evidence. PLoS One 2014;9:e98472. [CrossRef]
15. Kimura M. A simple method for estimating evolutionary rates of base substitutions through comparative studies of nucleotide sequences. J Mol Evol 1980;16:111-20. [CrossRef]
16. Tamura K, Stecher G, Kumar S. MEGA11:Molecular evolutionary genetics analysis version 11. Mol Biol Evol 2021;38:3022-7. [CrossRef]
17. Sanger F, Air GM, Barrell BG, Brown NL, Coulson AR, Fiddes JC, et al. Nucleotide sequence of bacteriophage φX174 DNA. Nature, 1977;265:687–695. (https://doi.org/https://doi.org/10.1038/265687a0). [CrossRef]
18. Johnson M, Zaretskaya I, Raytselis Y, Merezhuk Y, McGinnis S, Madden TL. NCBI BLAST:A better web interface. Nucleic Acids Res 2008;36:W5-9. [CrossRef]
19. WFO. Pometia pinnata J.R.Forst. &G.Forst. Available from https://www.worldfloraonline.org [Last accessed on 2023 Aug 25].
20. Edwards KJ, Gadek PA. Evolution and biogeography of alectryon (Sapindaceae). Mol Phylogenet Evol 2001;20:14-26. [CrossRef]
21. Charlesworth B, Sniegowski P, Stephan W. The evolutionary dynamics of repetitive DNA in eukaryotes. Nature 1994;371:215-20. [CrossRef]
22. Wellenreuther M, Mérot C, Berdan E, Bernatchez L. Going beyond SNPs:The role of structural genomic variants in adaptive evolution and species diversification. Mol Ecol 2019;28:1203-9. [CrossRef]
23. Wang Y, Yuan X, Zhang J. The complete chloroplast genome sequence of Pometia tomentosa. Mitochondrial DNA B 2019;4:3950-1. [CrossRef]
24. Wu Y. Accurate and efficient cell lineage tree inference from noisy single cell data:The maximum likelihood perfect phylogeny approach. Bioinformatics 2020;36:742-50. [CrossRef]
25. Hoang DT, Vinh LS, Flouri T, Stamatakis A, Von Haeseler A, Minh BQ. MPBoot:Fast phylogenetic maximum parsimony tree inference and bootstrap approximation. BMC Evol Biol 2018;18:11. [CrossRef]