
1. INTRODUCTION
The freshwater ecosystem comprises both ponds and lakes in which freshwater ponds constitute a variety of plants, phytoplanktons, aquatic animals, and prokaryotes [1]. The elements in freshwater ponds were mostly dependent on one another for their survival in the environment [2–4]. The blue-green algae (cyanobacteria) were prevalent in freshwater ponds and they maintain the biological balance and water quality. They also possess the capacity to perform carbon assimilation and N2 fixation and also secrete numerous biologically active substances, ultimately improving the productivity of the environment [5,6]. Particular species of cyanobacteria in the genera Anabaena, Aphanizomenon, Microcystis, and Oscillatoria were often formed persistent and extensive blooms in the aquaculture ecosystem [7,8]. Usually, cyanobacteria grow in close association with the number of microorganisms, which include eubacteria, fungi, and protozoans [9,10]. Cyanobacteria play a vital role in converting atmospheric nitrogen into organic forms, such as nitrate or ammonia, and they also perform photosynthesis and ultimately release oxygen as a byproduct which other plants could utilize for growth and survival [11,12] and act as the food source for other organisms like zooplanktons, insects, and snails [13]. Research has shown that only very few species belonging to cyanobacteria were commercially exploited [14,15]. Hence, a detailed research study was necessary on the biodiversity of cyanobacteria to figure out the role of cyanobacteria in the fresh water ponds; also, the diversity profile of cyanobacteria would reveal the extent of pollution and anthropogenic activities in the ecosystem. Various studies on blue-green algae present that the species residing in freshwater ponds include Microcystis sp., Cylindrospermopsis raciborskii, Synechococcus sp., Planktothrix agardhii, Gloeotrichia sp., Anabaena sp., Lyngbya sp., Nostoc spp., Oscillatoria spp., Schizothrix sp., and Synechocystis sp. [19–21]. The physicochemical parameters of the pond water (PW) were also studied as the population diversity hugely depends on the living environment [22]. An in-depth literature survey reveals that no physiological work has been accomplished in the fresh water ecosystem of Pudukkottai district, Tamil Nadu, India. This research work presents the isolation and characterization of different types of cyanobacteria in freshwater ponds of Pudukkottai district, Tamil Nadu, India, and the physical and chemical parameters of the fresh water ponds.
MATERIALS AND METHODOLOGY
2.1. Chemicals and Reagents
BG-11 medium was purchased from Sigma-Aldrich, USA; agar powder, sodium chloride (NaCl), and silver nitrate (AgNO3) were purchased from SRL Company, India, and Fisher Scientific, USA, respectively; sulfuric acid (H2SO4) was bought from Merck, USA; methyl red was purchased from SRL Company, India [25].
2.2. Sample Collection and Maintenance
The water samples were collected from fresh water ponds in Pudukkottai district, which is located in Tamil Nadu, India. The concentrated PW samples were collected using plankton net in sterilized bottles of 500 ml capacity at a depth of about 30 cm. After the collection of samples, it was viewed in cavity slide using a trinocular microscope (Labomed Vision 2000 microscope) by wet mount method to identify the different species present in the fresh water ecosystem. This was followed by inoculating the culture in liquid BG-11 medium. Later, the mixed culture was spread in agar plates containing BG-11 medium and the individual colonies were isolated. The mass culture of each colony was carried out by taking a loopful of distinct colonies from agar plates and transferring it to the conical flasks. This process was repeated until axenic cultures were obtained [25].
2.3. Morphological and Species Identification of cyanobacteria
Morphological identification of cyanobacteria was accomplished by spreading an isolated pure culture on glass slides with the help of forceps. The cultures were covered with glass cover slips and their size, shape, color, and other features were observed under low (10×) and high power (100×) objective lens of the trinocular microscope (Labomed Vision 2000 Microscope). Numerous species of cyanobacteria present in fresh water ponds of Pudukkottai district were identified and confirmed using the book written by T.V. Desikachary [16] and also with the help of the “Manual of Freshwater Algae of Tamil Nadu” [17].
2.4. Physical Parameters
All the physical parameters were recorded during the time of collection directly at the site. The pH and temperature were measured using Labline digital pH meter and digital probe thermometer. The color of the sample was determined by a visual comparison of fresh PWs. Total dissolved solids (TDS) and electrical conductivity (EC) values were measured using the RP Scientific TDS and EC meter. Similarly, the turbidity of PW samples was tested using Labtronics Digital Turbidity Meter [18].
2.5. Chemical Parameters
2.5.1. Dissolved oxygen (DO)
The titration method was used to estimate the dissolved oxygen (DO). MnSO4 (1 ml) and alkaline iodide (1 ml) reagent were mixed, which formed a flocculent precipitate. 1.0 ml of conc. H2SO4 was added to the precipitate. 50 ml of this solution was transferred to a conical flask and titrated against 0.025 N of Na2S2O3 till the color of the solution turned pale yellow. Then, the starch solution (1 ml) was added to give a blue color and the titration was completed by making it into a colorless solution using the following formula:
DO (mg/l) = No. of ml of Na2S2O3 solution × 4 [18].
2.5.2. Free carbon dioxide (CO2)
Exactly, 100 ml water sample was added to the phenolphthalein indicator of two to three drops and then titrated against 0.05 N sodium hydroxide, until a pink color appeared. The free CO2 was calculated using the following formula:
where,
B.R. = Burette reading (amount of titrant used);
N = Normality of sodium hydroxide;
44 = Equivalent weight of CO2 [18].
2.5.3. Biochemical oxygen demand (BOD)
The diluted water sample was prepared by bubbling compressed air in distilled water for about 30 minutes. Ferric chloride solution was added with the diluted water sample and mixed thoroughly with every 1 ml of phosphate buffer, magnesium sulfate, and calcium chloride. Using 1 N NaOH and H2SO4, the sample was neutralized to adjust the pH at 7.0. As the DO in the sample was likely to be exhausted, appropriate dilution of the sample was prepared with respect to the expected BOD range. Two sets of dilutions were prepared in a large glass and filled in the BOD bottles in a trough and the contents were mixed thoroughly. One set of the bottle was kept in the BOD incubator at 27°C for 3 days, and the DO content in another set was measured immediately. For blanks, two BOD bottles were filled with the diluted water sample. The DO content was determined immediately in one of the bottles and the other bottle was incubated and the DO content was determined after 3 days using the following formula:
BOD (mg/1) = (D0 – D3) * dilution factor
where D0 = Initial D0 in the sample and D3 = D0 after 3 days [19].
2.5.4. Chemical oxygen demand (COD)
Exactly, 20 ml of the sample was taken in a 250–500 ml COD flask. Exactly, 10 ml of copper sulfate solution was added along with a pinch of Ag2SO5 and HgSO4, followed by 30 ml H2SO4. The contents were then refluxed on a hot plate for at least 2 hours. The flask was removed, cooled, and distilled water was added to make the final volume to about 140 ml. Two to three drops of ferroin indicator were mixed thoroughly and titrated with 0.01 N (confirm) ferrous ammonium sulfate. At the end point, the blue-green color of contents will be changed to reddish blue. The blank was run simultaneously using distilled water in a similar manner using the following formula:
where,
B = volume of titrant used in blank;
S = titrant volume of used in sample;
N = strength of the titrant [19].
2.5.5. Estimation of nitrogen, phosphorous, and potassium (NPK)
Estimation of NPK was carried out by the kit procedure (Agrinex Soil Doctor — Rapid N-P-K Testing Kit). Briefly, the water sample was mixed with double distilled water in 1:2 ratio and mixed thoroughly. The sample was kept for 30 minutes for clear water separation. NPK was estimated by taking 5 ml of the PW sample and mixing it with Doctor-N, Doctor-P, and Doctor-K capsule respectively. Only for phosphorus estimation, four drops of trichloroacetic acid (TCA) reagent were added carefully and mixed well. The solution was mixed thoroughly, until the chemical was dissolved. The tube was kept at room temperature for 20 minutes for color development. The color formation was referred with the given reference chart to find out the concentration of the sample [19].
3. RESULTS
3.1. Species Isolation and Identification of cyanobacteria in Fresh Water Ponds
Cyanobacteria population biodiversity in fresh water ponds of Pudukkottai district were identified and characterized. The result concludes that 42 versatile species of 25 different families of cyanobacteria has been distributed in the 20 different fresh water ponds of Pudukkottai district, Tamil Nadu, India. Each and every species has its own significance, varying in size, shape, and color, which distinguishes them to be classified under different families. Among the PWs surveyed, it was seen that PW 5 and PW 6 contain a huge variety of cyanobacterial species belonging to Oscillatoriaceae and Microcystaceae family. Table 1 shows the species isolated from 20 different fresh water ponds. Figure 1 shows the 42 isolated species from the fresh water ecosystem. PW 13 has shown not even a single cyanobacterial population, whereas PWs 2, 4, 7, 8, 10, 11, 12, 14, 19, and 20 were found to contain a single species of cyanobacteria. The other PWs showed fewer cyanobacterial species. The majority of the algal species belonged to the families Oscillatoriaceae, Nostocaceae, Microcystaceae, Scenedesmaceae, and Desmidiaceae. Table 2 shows the family classification of isolated cyanobacterial species in fresh water ponds.
3.2. Physicochemical parameters of fresh water ponds
After the isolation and identification of cyanobacteria, the physicochemical parameters of the ponds were examined as the cyanobacterial biodiversity greatly depends on it. The physical parameter analysis of the fresh water ponds showed that the pH was in the range of 5.3–8.0, temperature varied from 84.5 to 86.6°F, TDS values differed between 87 and 2,655 mg/l, turbidity and EC were in the range of 0.08–0.7 nephelometric turbidity unit and 158–1,433 μmhos/cm. In case of chemical parameters surveyed, DO varied from 2.1 to 10.25 mg/l, free CO2 ranged from 0 to 9.5 mg/l, the values of NPK lied in the range of 0.2–0.4 mg/l, 0.15–0.5 mg/l, and 0.05–0.2 mg/l, respectively. Also, the BOD and COD values were found to vary from 5.36 to 26.75 mg/l and 12.24 to 48.73 mg/l, respectively. Tables 3 and 4 show the physical and chemical parameters of fresh water ponds, respectively.
4. DISCUSSION
The physical and chemical changes in the environment might influence a particular species and could also induce its growth and abundance in the environment in which they survive [23,24]. The parameters that influence the growth of cyanobacteria in the fresh water ponds include oxidizable matter, nitrogenous content, light intensity, and dissolved oxygen [25–30]. Also, the water level fluctuations might lead to an increase or decrease in the cyanobacterial species diversity. In the present research work, the samples were collected to analyze the biodiversity of cyanobacteria and the dominant species growing in fresh water ponds were noted. Among the 20 different PWs studied, it was seen that PW 5 and PW 6 hold many different species of cyanobacteria and the results may be attributed to the fact that the environment showed high pH values (alkaline = 8.0) and low DO content (2.1 and 2.95 ppm, respectively) compared to all other fresh water ponds having 22.76 and 38.62 mg/l for PW 5 and 21.27 and 32.94 mg/l for PW 6 of BOD and COD values, respectively. The pH value for all the PWs except PW 13 ranged from neutral to slightly alkaline, which lies within the values preferred by the WHO (6.5–8.5) [31]. Neutral to alkaline pH was found to be very suitable for the growth of cyanobacteria [30]. The increased values of BOD, COD, phosphates, and nitrates with low DO and alkaline pH range favored the growth of cyanobacteria compared to any other algae in the ecosystem [32–34]. PW 13 does not contain any cyanobacterial population that could be due to the high acidic nature of PW (pH 5.3), i.e., the reports claim no cyanobacterial population will exist in pH 5–5.5 and the researchers also studied the influence of water quality on cyanobacterial population growth [35,36]. These results conclude that the species growth increases with an increase in pH and BOD, and a decrease in DO values. The temperature was recorded in the range of 84°F–86°F (28°C–30°C) at the time of collection of samples and it was found to be the optimal temperature for the growth of cyanobacterial species [37,38]. The EC is the ability of PW to conduct current which purely depends on the ionic strength of the water ecosystem and it was seen that the values for all the PWs lie within the prescribed limit, i.e., 20–1,500 μmhos/cm [39]. However, the prescribed EC value given by the WHO is 250 μmhos/cm [31]. Total dissolved solid values represent the amount of dissolved substances and their values ≤600 mg/l was regarded as better water quality. Also, the natural waters tend to have values from 30 mg/l to 6,000 mg/l [31]. The presence of adequate amounts of NPK is essential for the cyanobacterial blooms to persist in PWs [40]. Depletion of free CO2 in PWs might trigger harmful cyanobacterial blooms as a result of increased influx of CO2 due to elevated concentration gradient in the surface water [41]. Hence CO2 also plays a major role in controlling the growth of cyanobacteria. The free CO2 values for all the PWs were found to be less than 10 mg/l. Many researchers attempted to study various fresh water ponds in different localities and isolated distinct cyanobacterial species. In the present observation of percentage distribution of cyanobacteria, Chlorophyceae holds the top position having 40%, followed by Cyanophyceae 36%, Bacillariophyceae 16%, Ulvophyceae 4%, and Dinophyceae 4%, i.e., the number of families belonging to the above-said classes were 10, 9, 4, 1, and 1 out of 25 families, respectively. The predominant distribution of Chlorophyceae, followed by Cyanophyceae, was also reported by researchers who studied the phytoplankton diversity in perennial lakes of Coimbatore [29]. Figure 2 shows the percentage composition of cyanobacterial diversity in 20 different fresh water ponds of Pudukkottai district. The algal flora community from temple tanks in Chennai city, Tamil Nadu, India, showed 17 species of algae isolated from the tanks and classified under four different families, including Cyanophyceae, Bacillariophyceae, Chlorophyceae, and Euglenophyceae [42]. The biodiversity and the relationship between the abundance of cyanobacteria concludes that the high concentration of dissolved organic matter occurred as a result of oxygen depletion [43]. The dominant species reported by Okogwu includes Microcystis aeruginosa, Aphanizomenon flos-aquae, Oscillatoria limnetica, and Anabaena spiroides, whereas the current study also shows the abundance of Microcystis sp. and Oscillatoria sp.in the fresh water ecosystem. Microcystis, particularly M. aeruginosa, is associated with permanent algal blooms in the fresh water ecosystem and also indicator of organic pollution. The dominance of cyanobacteria was due to their ability to grow in turbid water and also with low light intensity which helps in maintaining the buoyancy [25]. Furthermore, they possessed the capacity to grow exponentially in the wet period where the nitrogenous nutrients were found to be rich. In this present study, families like Naviculaceae, Microcystaceae, Scenedesmaceae, and Fragilariaceae were the representation of eutrophication and anthropogenic activities to a minimal extent. The present research work thoroughly analyzed the biodiversity of cyanobacteria in fresh water ponds of Pudukkottai district; furthermore, physiological, biochemical, and molecular level studies could be beneficial to understand the biodiversity of cyanobacteria in depth and its impact in the fresh water ecosystem.
 | Table 1. Cyanobacterial species isolated and classified from 20 different fresh water ponds in Pudukottai district. [Click here to view] |
 | Figure 1. Slide 1. Scenedesmus quadricauda; Slide 2. Cocconeis pediculus; Slide 3. Haematococcus lacustris; Slide 4. Cylindrocapsa geminella; Slide 5. Pediastrum simplex (Meyen) Lemm; Slide 6. Arthrospira platensis; Slide 7. Oscillatoria curviceps; Slide 8. Anabaenopsis arnoldii (aptekarj); Slide 9. Calothrix; Slide 10. Chroococcus turgidus; Slide 11. Scenedesemus arcuatus; Slide 12. Scendesmus vijugatus; Slide 13. Symploca jurassica; Slide 14. Spirulina subsalsa; Slide 15. Nostoc calcicola; Slide 16. Oscillatoria nigra; Slide 17. A. platensis; Slide 18. M. aeruginosa; Slide 19. Microcystis marginata; Slide 20. M. marginata; Slide 21. Lyngbya majuscula; Slide 22. M. aeruginosa; Slide 23. M. aeruginosa; Slide 24. Microcystis flos-aquae; Slide 25. Staurastrum pantanale sp. nov; Slide 26. Cladophora glomerata (L.); Slide 27. Chlorococcum humicola (Naeg ravenhorst); Slide 28. Closterium lunula (Mull); Slide 29. Spirogyra subsalsa (Kuetzing); Slide 30. Lyngbya aestuarii; Slide 31. Scendesmus denticulatus (lagerheim); Slide 32. Fragilaria crotomensis (Kitton); Slide 33. Microcystis robusta; Slide 34. Nostoc linckia; Slide 35. Merismopedia punctata Meyen; Slide 36. Scenedesmus acuminatus; Slide 37. Aphanocapsa pulchra (kutz); Slide 38. Lyngbya wollei; Slide 39. Ulothrix; Slide 40. Ceratium hirundinella; Slide 41. L. majuscule; and Slide 42. Oscillatoria princeps. [Click here to view] |
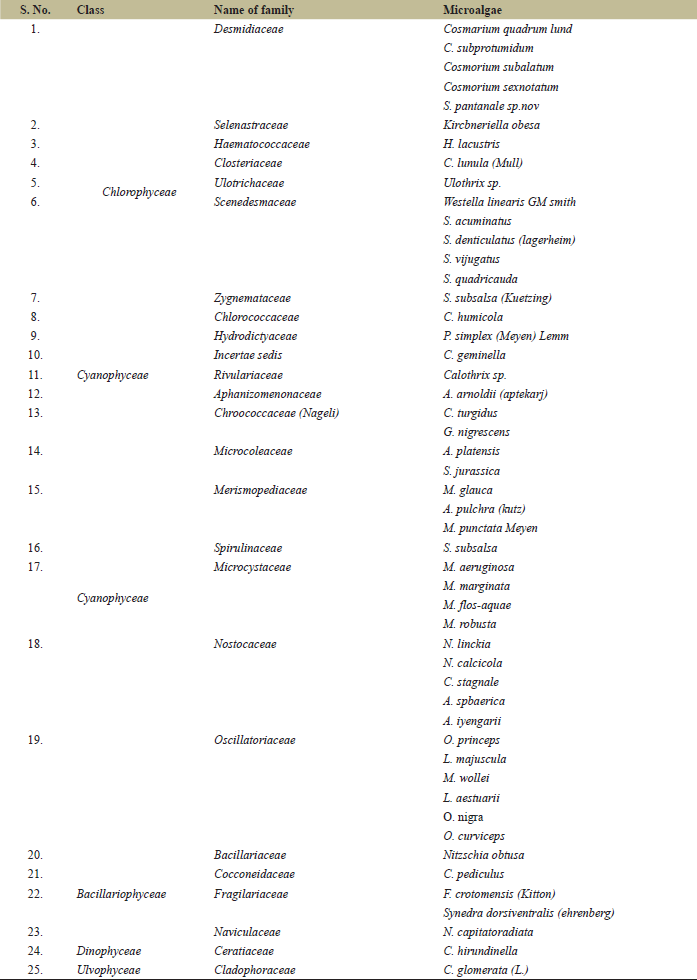 | Table 2. Family classification of identified cyanobacterial species from fresh water ponds. [Click here to view] |
 | Table 3. Physical parameters of fresh water ponds. [Click here to view] |
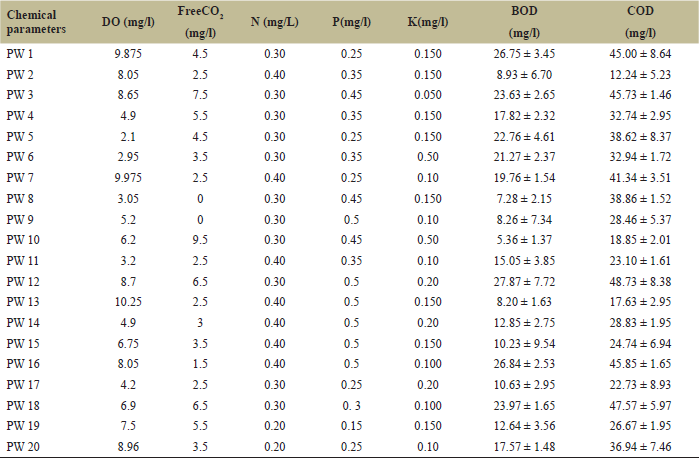 | Table 4. Chemical parameters of fresh water ponds. [Click here to view] |
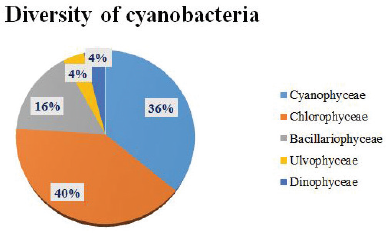 | Figure 2. Percentage distribution of cyanobacteria from 20 different fresh water ponds in Pudukkottai district, Tamil Nadu, India. [Click here to view] |
5. CONCLUSION
Many researchers studied the biodiversity of cyanobacteria in fresh water ponds and no such work has been carried out in the fresh water aquaculture in Pudukkottai district, Tamil Nadu, India. Also, this work highlighted the diversity of cyanobacteria in 20 different PWs by identifying approximately 42 distinct species of cyanobacteria of 25 different families. This paper also showed the physicochemical parameters influence on the species growth in the fresh water ecosystem. Hence, this work could be efficiently used as the basic research study in the analysis of cyanobacterial biodiversity in the fresh water ecosystem.
6. ACKNOWLEDGMENTS
The author thanks the JJ college of Arts and Science for providing constant support throughout the work. The authors disclose the existence of the preprints doi: 10.20944/preprints202011.0374.v1, which was available online on November 2020.
7. AUTHOR CONTRIBUTIONS
All authors made substantial contributions to conception and design, acquisition of data, or analysis and interpretation of data; took part in drafting the article or revising it critically for important intellectual content; agreed to submit to the current journal; gave final approval of the version to be published; and agree to be accountable for all aspects of the work. All the authors are eligible to be an author as per the international committee of medical journal editors (ICMJE) requirements/guidelines.
8. FUNDING
There is no funding to report.
9. CONFLICT OF INTEREST
The authors declare no conflicts of interest.
10. ETHICAL APPROVALS
This study does not involve experiments on animals or human subjects.
11. LIST OF ABBREVIATIONS
TDS Total dissolved solids
ECE lectrical conductivity
PW Pond water
CO2 Carbon-di-oxide
DO Dissolved oxygen
BOD Biological oxygen demand
COD Chemical oxygen demand
NPK Nitrogen, phosphorous and potassium
NTU Nephelometric turbidity unit
REFERENCES
1. Demoulin CF, Lara YJ, Cornet L, François C, Baurain D, Wilmotte A, et al. Cyanobacteria evolution: insight from the fossil record. Free Radic Biol Med 2019;1(4):206–23. CrossRef
2. Haraldsson M, Gerphagnon M, Bazin P, Colombet J, Tecchio S, Sime-Ngando T, et al. Microbial parasites make cyanobacteria blooms less of a trophic dead end than commonly assumed. ISME J 2018;12(4):1008–20. CrossRef
3. Konstantinou D, Gerovasileiou V, Voultsiadou E, Gkelis S. Sponges-cyanobacteria associations: global diversity overview and new data from the Eastern Mediterranean. PLoS One 2018;13(3):e0195001. CrossRef
4. Hilborn ED, Beasley VR. One health and cyanobacteria in freshwater systems: animal illnesses and deaths are sentinel events for human health risks. Toxins 2015;7(4):1374–95. CrossRef
5. Singh JS, Kumar A, Rai AN, Singh DP. Cyanobacteria: a precious bio-resource in agriculture, ecosystem, and environmental sustainability. Front Microbiol 2016;7 (2):529–32. CrossRef
6. Issa AA, Abd-Alla MH, Ohyama T. Nitrogen fixing cyanobacteria: future prospect. In: Ohyama T (ed.). Advances in biology and ecology of nitrogen fixation, InTech Publishers, Tokyo, Japan, pp 23–48, 2014
7. Paerl HW, Tucker CS. Ecology of blue-green algae in aquaculture ponds. J World Aquaculture Soc 1995;26(2):109–31. CrossRef
8. Sevrin-Reyssac J, Pletikosic M. Cyanobacteria in fish ponds. Aquaculture 1990; 88(1):1–20. CrossRef
9. Reed RH, Stewart WDP. Osmotic adjustment and organic solute accumulation in unicellular cyanobacteria from freshwater and marine habitats. Mar Biol 1985;88(1):1–9. CrossRef
10. Whitton BA, Potts M. Introduction to the cyanobacteria. In: Whitton BA, Potts M (eds.). Ecology of cyanobacteria II. Springer, Dordrecht, The Netherlands, vol. 5(3), pp 1–13, 2012. CrossRef
11. Havens KE. Cyanobacteria blooms: effects on aquatic ecosystems. Cyanobacterial harmful algal blooms: state of the science and research needs. In: H Kenneth Hudnell (ed.), Springer, New York, NY, pp 733–47, 2008. CrossRef
12. Murrell MC, Lores EM. Phytoplankton and zooplankton seasonal dynamics in a subtropical estuary: importance of cyanobacteria. J Plankton Res 2004;26(3):371–82. CrossRef
13. Sanchez-Baracaldo P. Origin of marine planktonic cyanobacteria. Sci Rep 2015;5(1):1–0. CrossRef
14. Wilson SD. Clinical Veterinary Advisor-E-Book. Elsevier Health Sciences, Amsterdam, The Netherlands, pp 1104, 2010.
15. D?ez B, Ininbergs, K. Ecological importance of cyanobacteria. Cyanobacteria 2014;106:41–63. CrossRef
16. Prasad AKSK. T.V. Desikachary (18 September 1919–5 November 2005). Phycologia 2019;47(2):118–23. CrossRef
17. Mahendra Perumal G, Anand N. Manual of freshwater algae of Tamil Nadu. Biodiversity of freshwater Algae in Tamil Nadu II. In: Anand N (ed.). Biology and biodiversity of microalgae. Centre for Advanced Studies in Botany, University of Madras, Chennai, India, pp 302–8, 2009
18. American Public Health Association, American Water Works Association, Water Pollution Control Federation and Water Environment Federation. Standard methods for the examination of water and wastewater. American Public Health Association, Washington, DC, vol. 2, 1912.
19. Ros P, Da CM, Silva CS, Silva-Stenico ME, Fiore MF, Castro HFD. Assessment of chemical and physico-chemical properties of cyanobacterial lipids for biodiesel production. Mar Drugs 2013;11(7):2365–81. CrossRef
20. Noel SD, Rajan MR, Sivakumar P. Cyanobacteria as a potential source of phycoremediation from textile industry effluent. J Microbiol Biotechnol Res 2014;4(6):33–5.
21. Sood A, Renuka N, Prasanna R, Ahluwalia AS. Cyanobacteria as potential options for wastewater treatment. Phytoremediation 2015;12(1):83–93 CrossRef
22. Khan S, Siddique R, Sajjad W, Nabi G, Hayat KM, Duan P, et al. Biodiesel production from algae to overcome the energy crisis. HAYATI J Biosci 2017;24(4):163–7. CrossRef
23. Tomlinson A, Drikas M, Brookes JD. The role of phytoplankton as pre-cursors for disinfection by-product formation upon chlorination. Water Res 2016;102:229–40. CrossRef
24. Reynolds CS. Phytoplankton periodicity: the interactions of form, function and environmental variability. Freshw Biol 1984;14(2):111–42. CrossRef
25. Muthukumar C, Muralitharan G, Vijayakumar R, Panneersevam A, Thajuddin N. Cyanobacterial biodiversity from different freshwater ponds of Thanjavur, Tamil Nadu (India). Acta Bot Malac 2007;32:17–25. CrossRef
26. Nayak B, Bhattacharyya S, Deep PR. Cyanobacteria in wetlands of the industrialized Sambalpur District of India. Aquat Biosyst 2013;9(1):1–2. CrossRef
27. Sankaran B, Thiruneelagandan E. Microalgal diversity of Parthasarathy temple tank, Chennai, India. Intern J Curr Microbiol Appl Sci 2015;4(4):168–73.
28. Thajuddin N, Subramanian G. Cyanobacterial biodiversity and potential applications in biotechnology. Curr Sci 2005;47–57.
29. Manickam N, Bhavan PS, Santhanam P, Muralisankar T, Kumar SD, Balakrishnan S, et al. Phytoplankton biodiversity in the two perennial lakes of Coimbatore, Tamil Nadu, India. Acta Ecol Sin 2020;40(1):81–9. CrossRef
30. Narchonai G, Arutselvan C, Oscar FL, Thajuddin N. Deciphering the microalgal diversity and water quality assessment of two urban temple ponds in Pondicherry, India. Biocatal Agric Biotechnol 2019;22:101427. CrossRef
31. WHO/UNEP, GEMS. Global freshwater quality. Alden Press, Oxford, UK, 1989.
32. Tillmanns AR, Wilson AE, Pick FR, Sarnelle O. Meta-analysis of cyanobacterial effects on zooplankton population growth rate: species-specific responses. Fundam Appl Limnol 2008;171(4):285. CrossRef
33. Shruthi MS, Rajashekhar M. Effect of salinity and growth phase on the biochemical composition of two diatom species isolated from estuarine waters near Mangalore, West Coast of India. Int J Adv Lif Sci 2014;7(1):135–42.
34. Madhumathi V, Vijayakumar S. Survey of cyanobacterial flora from Samuthiram Lake of Thanjavur, Tamil Nadu, India. J Algal Biomass Util 2013;4(1):70–9.
35. Dubey SK, Dubey J, Viswas AJ. Tiwari P. Studies on cyanobacterial biodiversity in paper mill and pharmaceutical industrial effluents. Biotechnol J Int 2011;1(3): 61–7. CrossRef
36. Okogwu O, Ugwumba AO. Seasonal dynamics of phytoplankton in two tropical rivers of varying size and human impact in Southeast Nigeria. Rev Biol Trop 2013;61(4):1827–40.
37. Davis TW, Berry DL, Boyer GL, Gobler CJ. The effects of temperature and nutrients on the growth and dynamics of toxic and non-toxic strains of Microcystis during cyanobacteria blooms. Harm Algae 2009;8(5):715–25. CrossRef
38. Robarts RD, Zohary T. Temperature effects on photosynthetic capacity, respiration, and growth rates of bloom-forming cyanobacteria. N Z J Mar Freshwater Res 1987;21(3):391–9. CrossRef
39. Boyd CE. Water quality in warmwater fish ponds (No. 639.3 B6923w Ej. 1 009523). Auburn University, Auburn, AL, 1979.
40. Wicks JR, Theil PG. Environmental factors affecting the production of peptide toxins in floating scums of the cyanobacterium Microcystis aeruginosa in a hypertrophic African reservoir. Environ Sci Technol 1990;24:1413–8. CrossRef
41. Visser PM, Verspagen JM, Sandrini G, Stal LJ, Matthijs HC, Davis TW, et al. How rising CO2 and global warming may stimulate harmful cyanobacterial blooms. Harm Algae 2016;54:145–59. CrossRef
42. Ja A, Chandrab S. Studies on fresh water algae in relation to chemical constituents of Thiruneermalai temple tank near Chennai, India.2012.
43. Umarani V, Palanivel S, Perumal UE. Algal Diversity of Arulmigu Sri Thiyagarajaswamy Temple Tank Thiruvottiyur, Chennai, Tamil Nadu, India. Indian J Scie Technol 2017;10(13):1–7. CrossRef